The Bollinger Bands Tracking Strategy

Overview
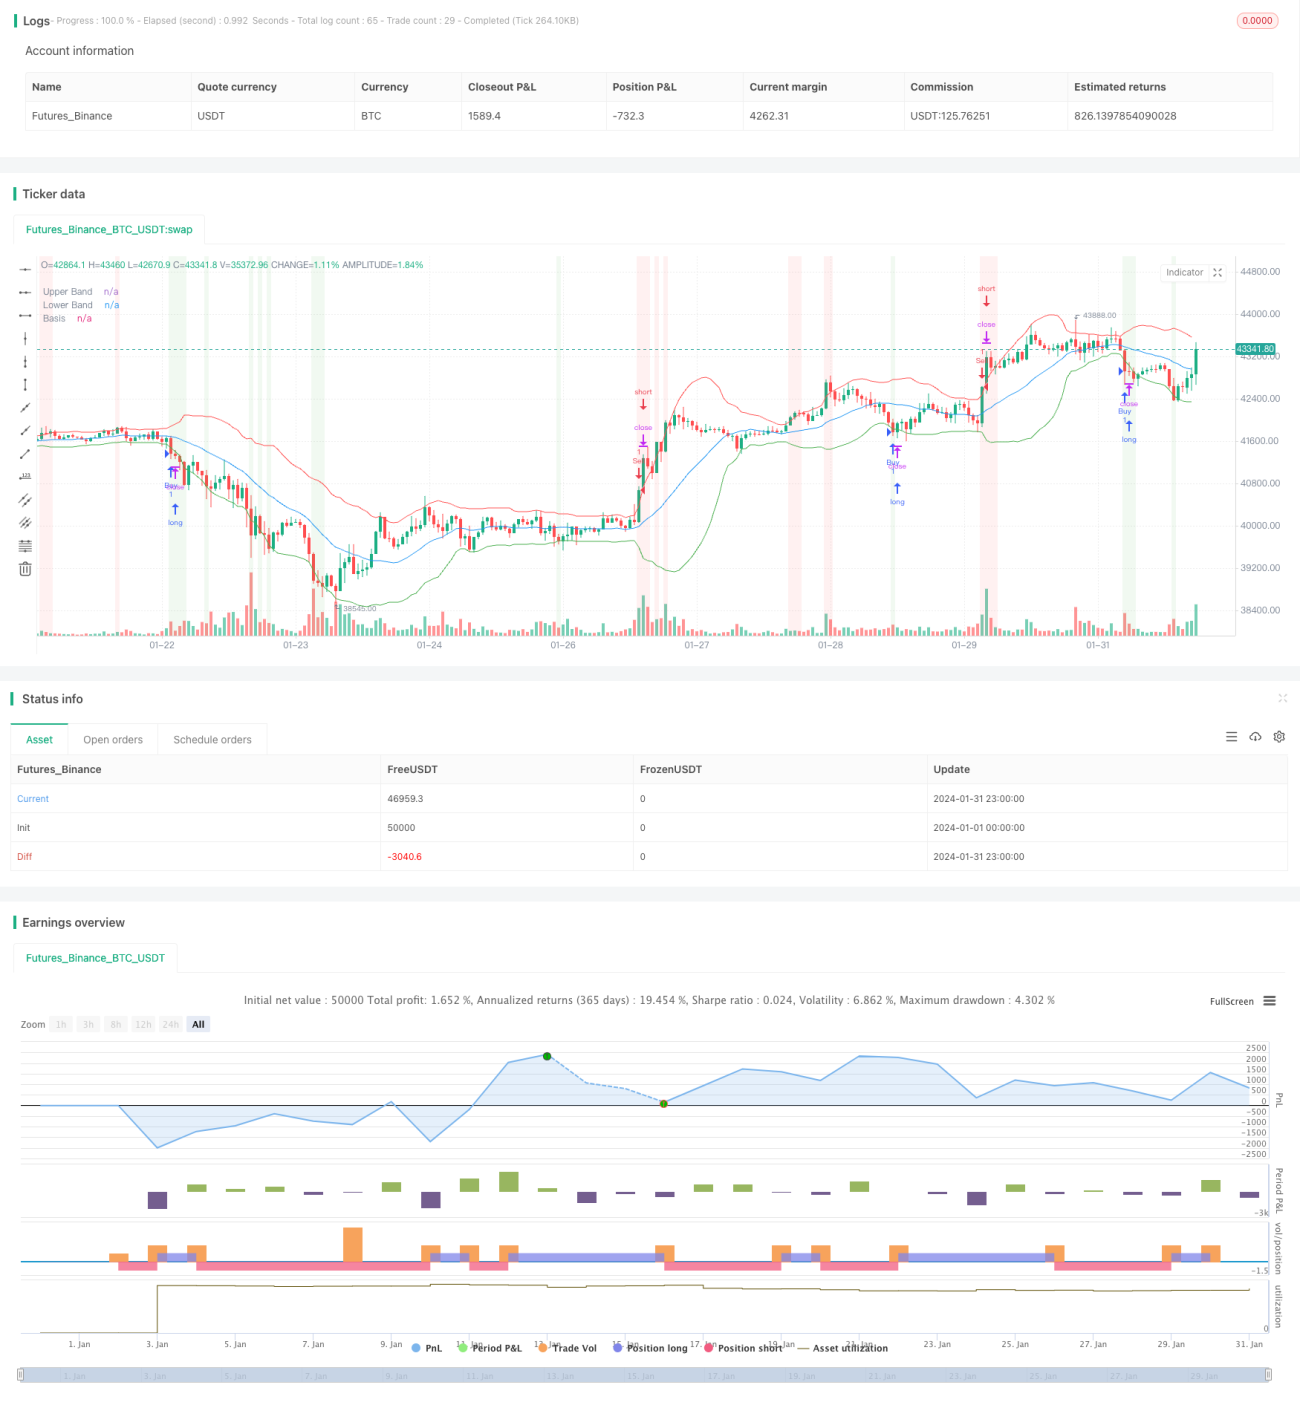
The Bollinger Bands tracking strategy is a quantitative trading strategy based on Bollinger Bands. It calculates the upper and lower rails of the Bollinger Bands of a stock and sets buy and sell conditions to track the market. When the price touches the lower rail of the Bollinger Bands, the stock is considered undervalued, Thus providing more room for growth and generating a buy signal; when the price rises and touches the upper rail, the stock is considered overvalued, genTherefore considered to beerating a sell sign.
Strategy Principle
The core indicator of this strategy is Bollinger Bands. Bollinger Bands consist of three lines: middle rail, upper rail and lower rail. The middle rail is the n-day moving average closing price; the upper rail is the middle rail + k times the n-day standard deviation of the closing price; the lower rail is the middle rail - k times the n-day standard deviation of the closing price. The k value is usually set to 2. When the stock price is lower than the lower rail, it is at a relatively low price level, Therefore considered to be lowervalued, generating a buy signal; when the stock price is higher than the upper rail, it is at a relatively high price level and is considered overvalued, generating a sell signal.
Specifically, this strategy first calculates the 20-day moving average of closing prices as the middle rail, and then calculates twice the 20-day standard deviation of closing prices as the bandwidth. The upper rail is the middle rail + bandwidth and the lower rail is the middle rail - bandwidth. It then sets the buy condition to be closing price lower than the lower rail, and sell condition to be closing price higher than the upper rail. It generates a buy signal when closing price is below the lower rail, and a sell signal when closing price is above the upper rail.
Advantage Analysis
This strategy has the following advantages:
- The principle is simple and easy to understand and implement.
- It can track market trends and automatically generate buy and sell signals.
- The risk of drawdown is relatively small with certain tracking stop-loss function.
- It can filter out false breakouts and avoid wrong operations in sideways markets.
- Parameters like period and standard deviation multiplier can be adjusted to adapt to different stocks and market environments.
Risk Analysis
There are also some risks with this strategy:
- Bollinger Bands is not a perfect indicator for buy and sell points, signals may lag.
- It cannot predict extreme market conditions, face black swan events like financial crises.
- Stock price may run on one side of the bands for long periods, resulting in insufficient signals.
- Parameter settings like period length need optimization, otherwise it may be too sensitive or inert.
Corresponding solutions:
- Combine with other indicators to confirm timing of trades
- Set stop loss and take profit to control maximum loss
- Optimize parameters to improve adaptability
- Adopt composite strategies to avoid sole reliance
Optimization Directions
The main optimization directions for this strategy includes:
- Optimize Bollinger Bands parameters like trying different period lengths and standard deviation multiplier to find the optimal fitting parameters.
- Incorporate other indicators like KDJ, MACD etc. to filter buy/sell decisions to avoid Bollinger Bands lagging issue.
- Apply machine learning algorithms to guide optimal parameter settings.
- Use deep learning to predict probability of price breaking out of bands.
- Adopt composite strategies with backup trading strategies to avoid excessive dependence on single strategy.
Conclusion
Overall, Bollinger Bands tracking strategy is a relatively simple and practical quantitative trading strategy. It can automatically track price trends and also provide buy and sell signals. The pros are easy implementation, smaller risks, filtering false breakouts. The cons are certain lagging, inability to face extreme market conditions like black swans. This strategy can be further enhanced through optimizing parameters and indicators, using more advanced techniques like machine learning. In summary, combining Bollinger Bands strategies with other technical strategies can form a robust and efficient quantitative trading system.
- 1