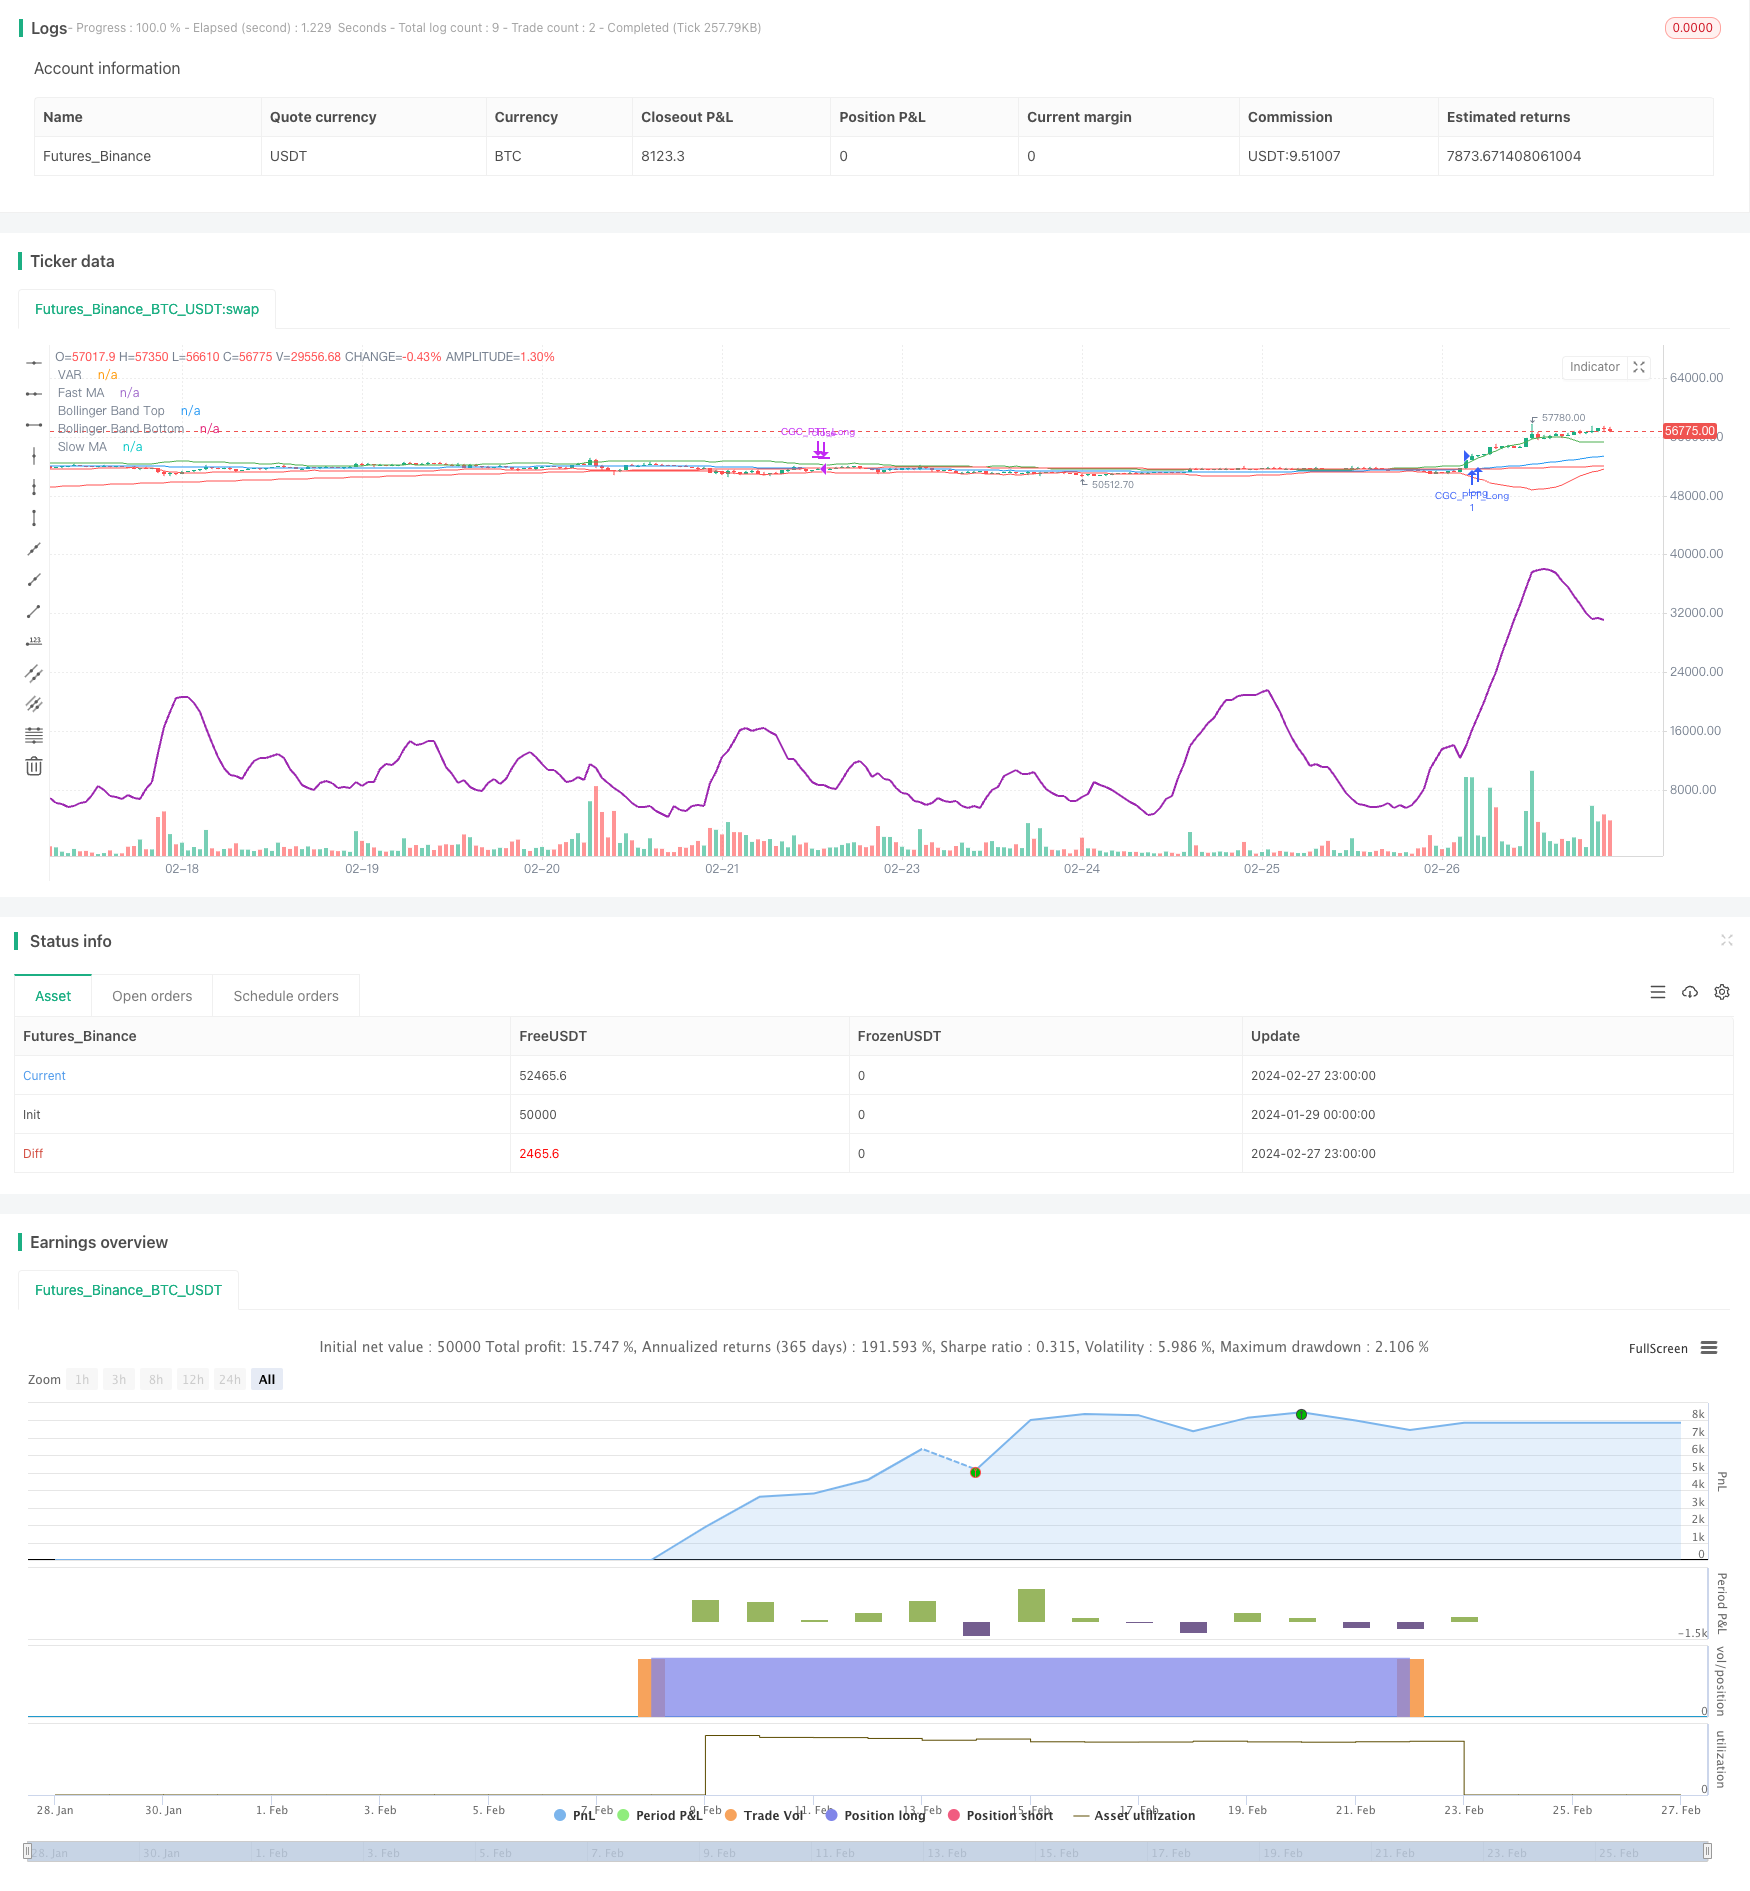
概述
双均线波动率跟踪策略融合了金叉死叉策略和均线波动率指标追踪策略两大思路。通过计算不同周期的简单移动均线交叉实现金叉死叉判定,同时结合Bollinger波动带和VIDYA指标判断市场趋势和波动率,实现了对趋势的清晰判断和对关键点的高效捕捉。
策略原理
该策略的核心指标包括简单移动平均线、Bollinger波动带和VIDYA波动率指数均线。策略通过设置快线SMA和慢线LMA的不同周期,快慢线的黄金交叉作为做多信号,死叉作为平仓信号。同时,Bollinger波动带判断持仓过程中价格突破上下轨的情况。VIDYA指数移动平均线结合波动率信息,判断当前趋势方向和强度。
具体来说,做多的信号逻辑为快线上穿慢线,且价格高于VIDYA曲线,表明具备趋势上行和波动放大的前提;平仓信号为快线下穿慢线或价格低于VIDYA曲线,表明趋势反转或波动趋于收缩。
优势分析
双均线波动率跟踪策略最大的优势在于结合双重指标判断市场状态,能够提高决策的准确性。具体来说,优势体现在:
- 金叉死叉策略简单有效,能清晰判断趋势转折点;
- 波动率指标VIDYA能动态跟踪市场波动变化;
- Bollinger波动带判断让策略及时响应价格震荡。
综上,该策略整合了趋势、回归和波动率等多个维度的信息,对市场变化的响应速度更快,从而获得超额收益的可能性更大。
风险分析
尽管该策略有许多优点,但也存在一定的风险需要警惕:
- 参数设置不当可能导致过于频繁交易,增加交易成本和滑点损失;
- 双重指标判断中出现信号冲突时需要明确优先级,否则可能错过最佳入场时机;
- 策略回测存在过拟合风险,实盘表现可能与回测结果有较大差异。
为降低上述风险,建议优化参数设置,明确指标信号的优先级,增加滑点控制,并在不同市场环境中多次验证策略稳健性。
优化方向
该策略的主要优化方向集中在参数设定与过滤条件上,可以从以下几个维度进行:
- 优化快线和慢线的均线周期参数;
- 调整Bollinger波动带的带宽参数;
- 优化VIDYA中的α平滑参数;
- 增加价格或交易量异常过滤条件。
通过参数优化与规则优化的结合,可以进一步提升策略的稳定性与收益率。
总结
双均线波动率跟踪策略综合运用多种指标判断市场状态,在捕捉趋势转折的同时关注价格波动情况,是一种风险收益兼顾的有效策略。该策略优化空间较大,值得进一步探索与验证,期待在实盘中取得可观的超额收益。
策略源码
/*backtest
start: 2024-01-29 00:00:00
end: 2024-02-28 00:00:00
period: 1h
basePeriod: 15m
exchanges: [{"eid":"Futures_Binance","currency":"BTC_USDT"}]
*/

//@version=5
strategy("Combined Golden Cross and Progressive Trend Tracker", shorttitle="GCC-PTT", overlay=true)

// Inputs
fastMA_period = input(50, title="Fast MA Period")
slowMA_period = input(200, title="Slow MA Period")
src = input(close, title="Source")
lengthBB = input(20, title="Bollinger Bands Length")
mult = input(2.0, title="Bollinger Bands Multiplier")
mavType = input.string(title="Moving Average Type", defval="VAR", options=['SMA', 'EMA', 'WMA', 'TMA', 'VAR', 'WWMA', 'ZLEMA', 'TSF'])

// Calculate Moving Averages for Golden Cross
fastMA = ta.sma(src, fastMA_period)
slowMA = ta.sma(src, slowMA_period)
bullish_cross = ta.crossover(fastMA, slowMA)
bearish_cross = ta.crossunder(fastMA, slowMA)

// Progressive Trend Tracker Components (Adjusted for NA assignment issue)
Var_Func(src, length) =>
    valpha = 2 / (length + 1)
    vud1 = src > src[1] ? src - src[1] : 0
    vdd1 = src < src[1] ? src[1] - src : 0
    vUD = math.sum(vud1, length)
    vDD = math.sum(vdd1, length)
    vCMO = (vUD - vDD) / (vUD + vDD)
    VAR = 0.0 // Adjusted here, assign an initial value
    VAR := ta.ema(src * math.abs(vCMO), length)
    VAR

VAR = Var_Func(src, 14) // Example VAR calculation, adjust as needed

// Bollinger Bands for dynamic support and resistance
BBandTop = fastMA + mult * ta.stdev(src, lengthBB)
BBandBot = fastMA - mult * ta.stdev(src, lengthBB)

// Plotting
plot(fastMA, color=color.blue, title="Fast MA")
plot(slowMA, color=color.red, title="Slow MA")
plot(BBandTop, color=color.green, title="Bollinger Band Top")
plot(BBandBot, color=color.red, title="Bollinger Band Bottom")
plot(VAR, color=color.purple, title="VAR", linewidth=2)

// Strategy Logic (Adjusted for strategy use)
// Long Entry when bullish cross and close above VAR
// Exit when bearish cross or close below VAR
if (bullish_cross and close > VAR)
    strategy.entry("CGC_PTT_Long", strategy.long)
if (bearish_cross or close < VAR)
    strategy.close("CGC_PTT_Long")