概述
该策略采用多时间框架均线的方法,利用长期均线判断大趋势方向,短期均线判断短期趋势方向,在长线和短线确认趋势一致时,进场做多/空;当短线回调到长线附近时,判断形成短期调整进入机会,此时做反向操作。该策略主要适用于中长线趋势性股票。
策略原理
该策略使用200日简单移动均线判断长期趋势方向,使用10日简单移动均线判断短期趋势方向。当股价高于200日均线且低于10日均线时,说明目前处于长线上升和短线回调阶段,此时做多;当股价低于200日均线且高于10日均线时,说明目前处于长线下降和短线反弹阶段,此时做空。
具体来说,当满足如下条件时,做多入场:收盘价>200日均线 且 收盘价<10日均线;当满足如下条件时,做空入场:收盘价<200日均线 且 收盘价>10日均线。
入场后设置止损机制,如果从买入价回撤超过10%,则止损出场。同时,如果设置了i_lowerClose选项,则会等待较低的收盘价出现后再出场,这可以避免止损过于敏感。
优势分析
该策略结合多时间框架均线,可以在较大概率上捕捉中长线趋势的方向。当短期均线回调到长期均线时,utsch策略提供较好的入场时机。与单一均线系统相比,可以减少因短期调整而被套的概率。
该策略风险可控。设置了10%的止损比例以控制亏损;同时设置了时间过滤条件,可以避免在特定时间段交易。
风险分析
该策略依然存在被套的风险。当短线调整的时间过长或调整幅度过大时,可能触发止损而被套出场。这时就面临亏损的风险。
该策略对交易品种的适配性较差。对于波动性大,调整时间长的股票,该策略容易被止损出场,效果不佳。
在市场整体发生重大调整时,该策略也会面临较大亏损。例如金融危机期间,该策略可能难以获利。
优化方向
可以引入更多均线系统,形成多重筛选机制。例如加入50日均线,只有当收盘价处于50日均线与200日均线之间时才考虑入场。这可以进一步筛选出趋势性较好的品种。
可以设置浮动止损。具体来说,入场后,可以根据股票的波动范围,设置可变化的止损幅度,而不是固定的10%止损。这可以减少不必要的止损被触发的概率。
可以结合其他指标判断市场状况。例如MACD,在MACD显示市场脱离时,可以暂停该策略,避免亏损。这可以根据大市场判断来控制策略的启动与关闭。
总结
该策略整体来说是一种典型的多时间框架均线策略。它结合长短期均线,在大概率捕捉中长线趋势的同时,抓住短线回调机会入场。策略风险也在可控范围内。通过引入更多指标、优化止损方式等,可以进一步增强该策略的稳定性。
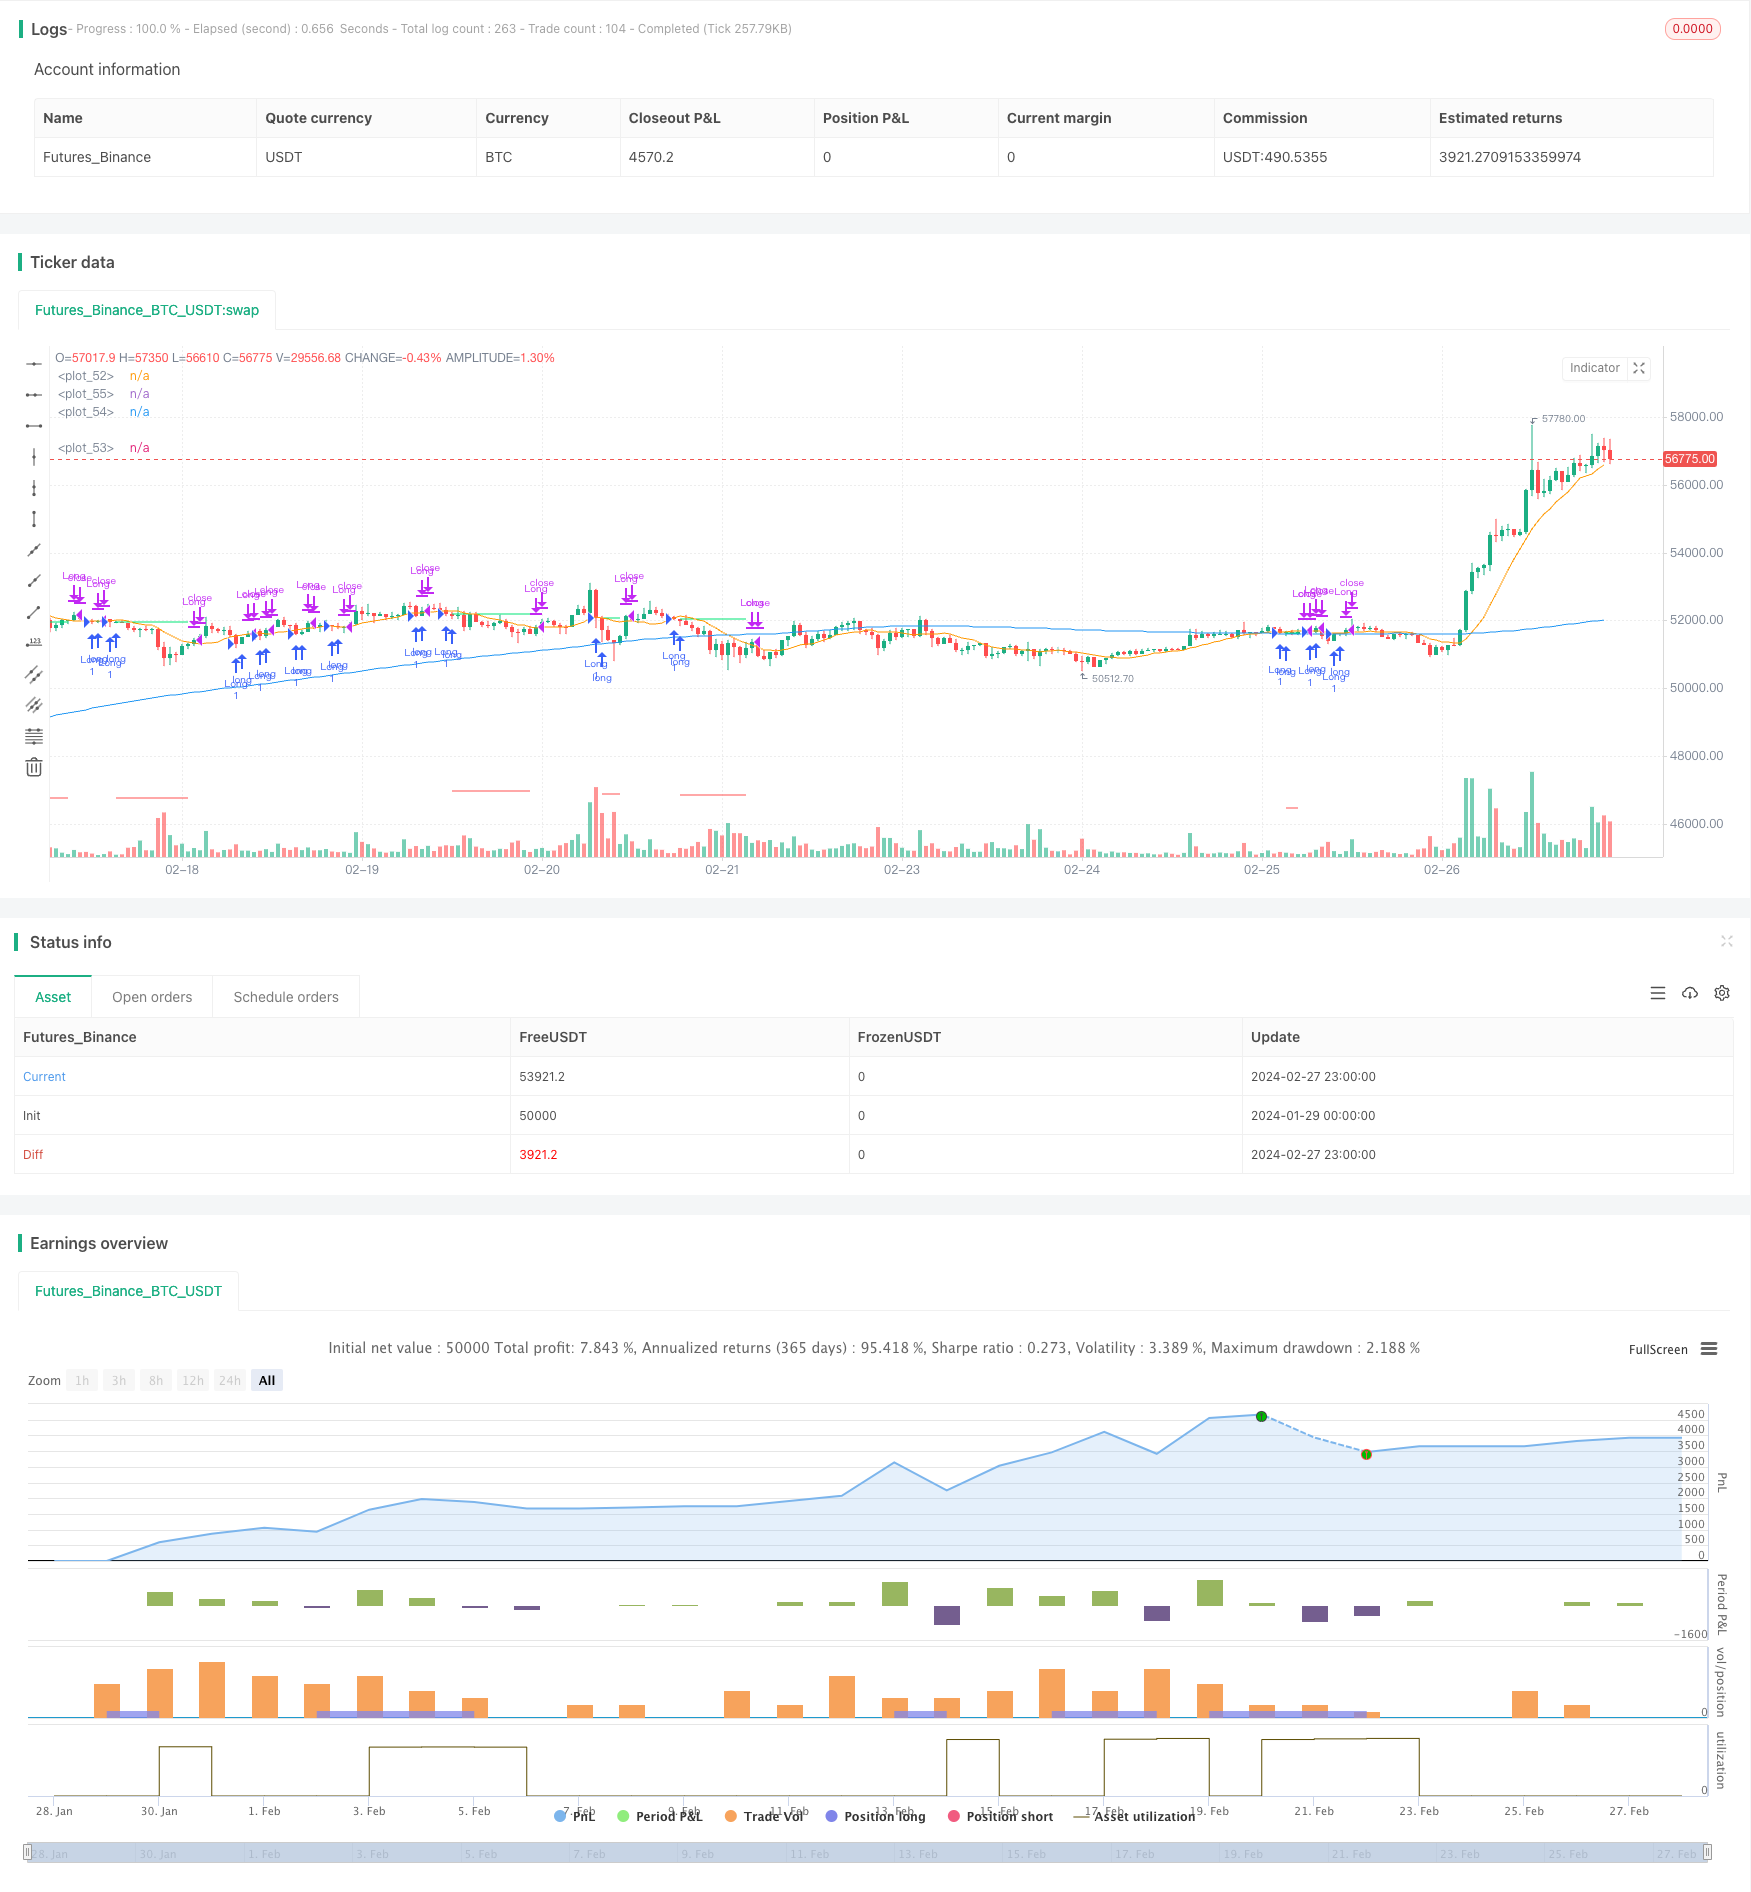
/*backtest
start: 2024-01-29 00:00:00
end: 2024-02-28 00:00:00
period: 1h
basePeriod: 15m
exchanges: [{"eid":"Futures_Binance","currency":"BTC_USDT"}]
*/

// This Pine Script™ code is subject to the terms of the Mozilla Public License 2.0 at https://mozilla.org/MPL/2.0/
// © irfanp056
// @version=5

strategy("Simple Pullback Strategy",
     overlay=true) // Interactive Brokers rate

// Get user input
i_ma1           = input.int(title="MA 1 Length", defval=200, step=10, group="Strategy Parameters", tooltip="Long-term MA")
i_ma2           = input.int(title="MA 2 Length", defval=10, step=10, group="Strategy Parameters", tooltip="Short-term MA")
i_stopPercent   = input.float(title="Stop Loss Percent", defval=0.10, step=0.1, group="Strategy Parameters", tooltip="Failsafe Stop Loss Percent Decline")
i_lowerClose    = input.bool(title="Exit On Lower Close", defval=false, group="Strategy Parameters", tooltip="Wait for a lower-close before exiting above MA2")
i_startTime     = input(title="Start Filter", defval=timestamp("01 Jan 1995 13:30 +0000"), group="Time Filter", tooltip="Start date & time to begin searching for setups")
i_endTime       = input(title="End Filter", defval=timestamp("1 Jan 2099 19:30 +0000"), group="Time Filter", tooltip="End date & time to stop searching for setups")

// Get indicator values
ma1 = ta.sma(close, i_ma1)
ma2 = ta.sma(close, i_ma2)

// Check filter(s)
f_dateFilter = true

// Check buy/sell conditions
var float buyPrice = 0
buyCondition    = close > ma1 and close < ma2 and strategy.position_size == 0 and f_dateFilter
sellCondition   = close > ma2 and strategy.position_size > 0 and (not i_lowerClose or close < low[1])
stopDistance    = strategy.position_size > 0 ? ((buyPrice - close) / close) : na
stopPrice       = strategy.position_size > 0 ? buyPrice - (buyPrice * i_stopPercent) : na
stopCondition   = strategy.position_size > 0 and stopDistance > i_stopPercent

// Enter positions
if buyCondition
    strategy.entry(id="Long", direction=strategy.long)

if buyCondition[1]
    buyPrice := open

// Exit positions
if sellCondition or stopCondition
    strategy.close(id="Long", comment="Exit" + (stopCondition ? "SL=true" : ""))
    buyPrice := na

// Draw pretty colors
plot(buyPrice, color=color.lime, style=plot.style_linebr)
plot(stopPrice, color=color.red, style=plot.style_linebr, offset=-1)
plot(ma1, color=color.blue)
plot(ma2, color=color.orange)