概述
动量平均向导指数移动平均交叉策略将两个强大的技术指标——移动平均线(MA)和平均方向指数(ADX)结合在一起,为交易者提供更精确的技术分析。该策略专为动态市场分析而设计,可提供清晰的交易信号。
策略原理
该策略通过计算加权移动平均线(WMA)对价格动量进行跟踪,平滑价格波动,生成趋势信号。同时,计算平均方向指数(ADX)和正负向动量指数(+/-DI),判断趋势的存在和力度。当ADX高于指定参数时,认为趋势存在;当正向动量指数高于负向动量指数时,为看涨信号。
策略以MA和ADX指标的交叉作为交易决策的依据。当ADX高于阈值,且DIdiff(DI+ - DI-)大于0时,做多;当ADX高于阈值,且DIdiff小于0时,平仓。
优势分析
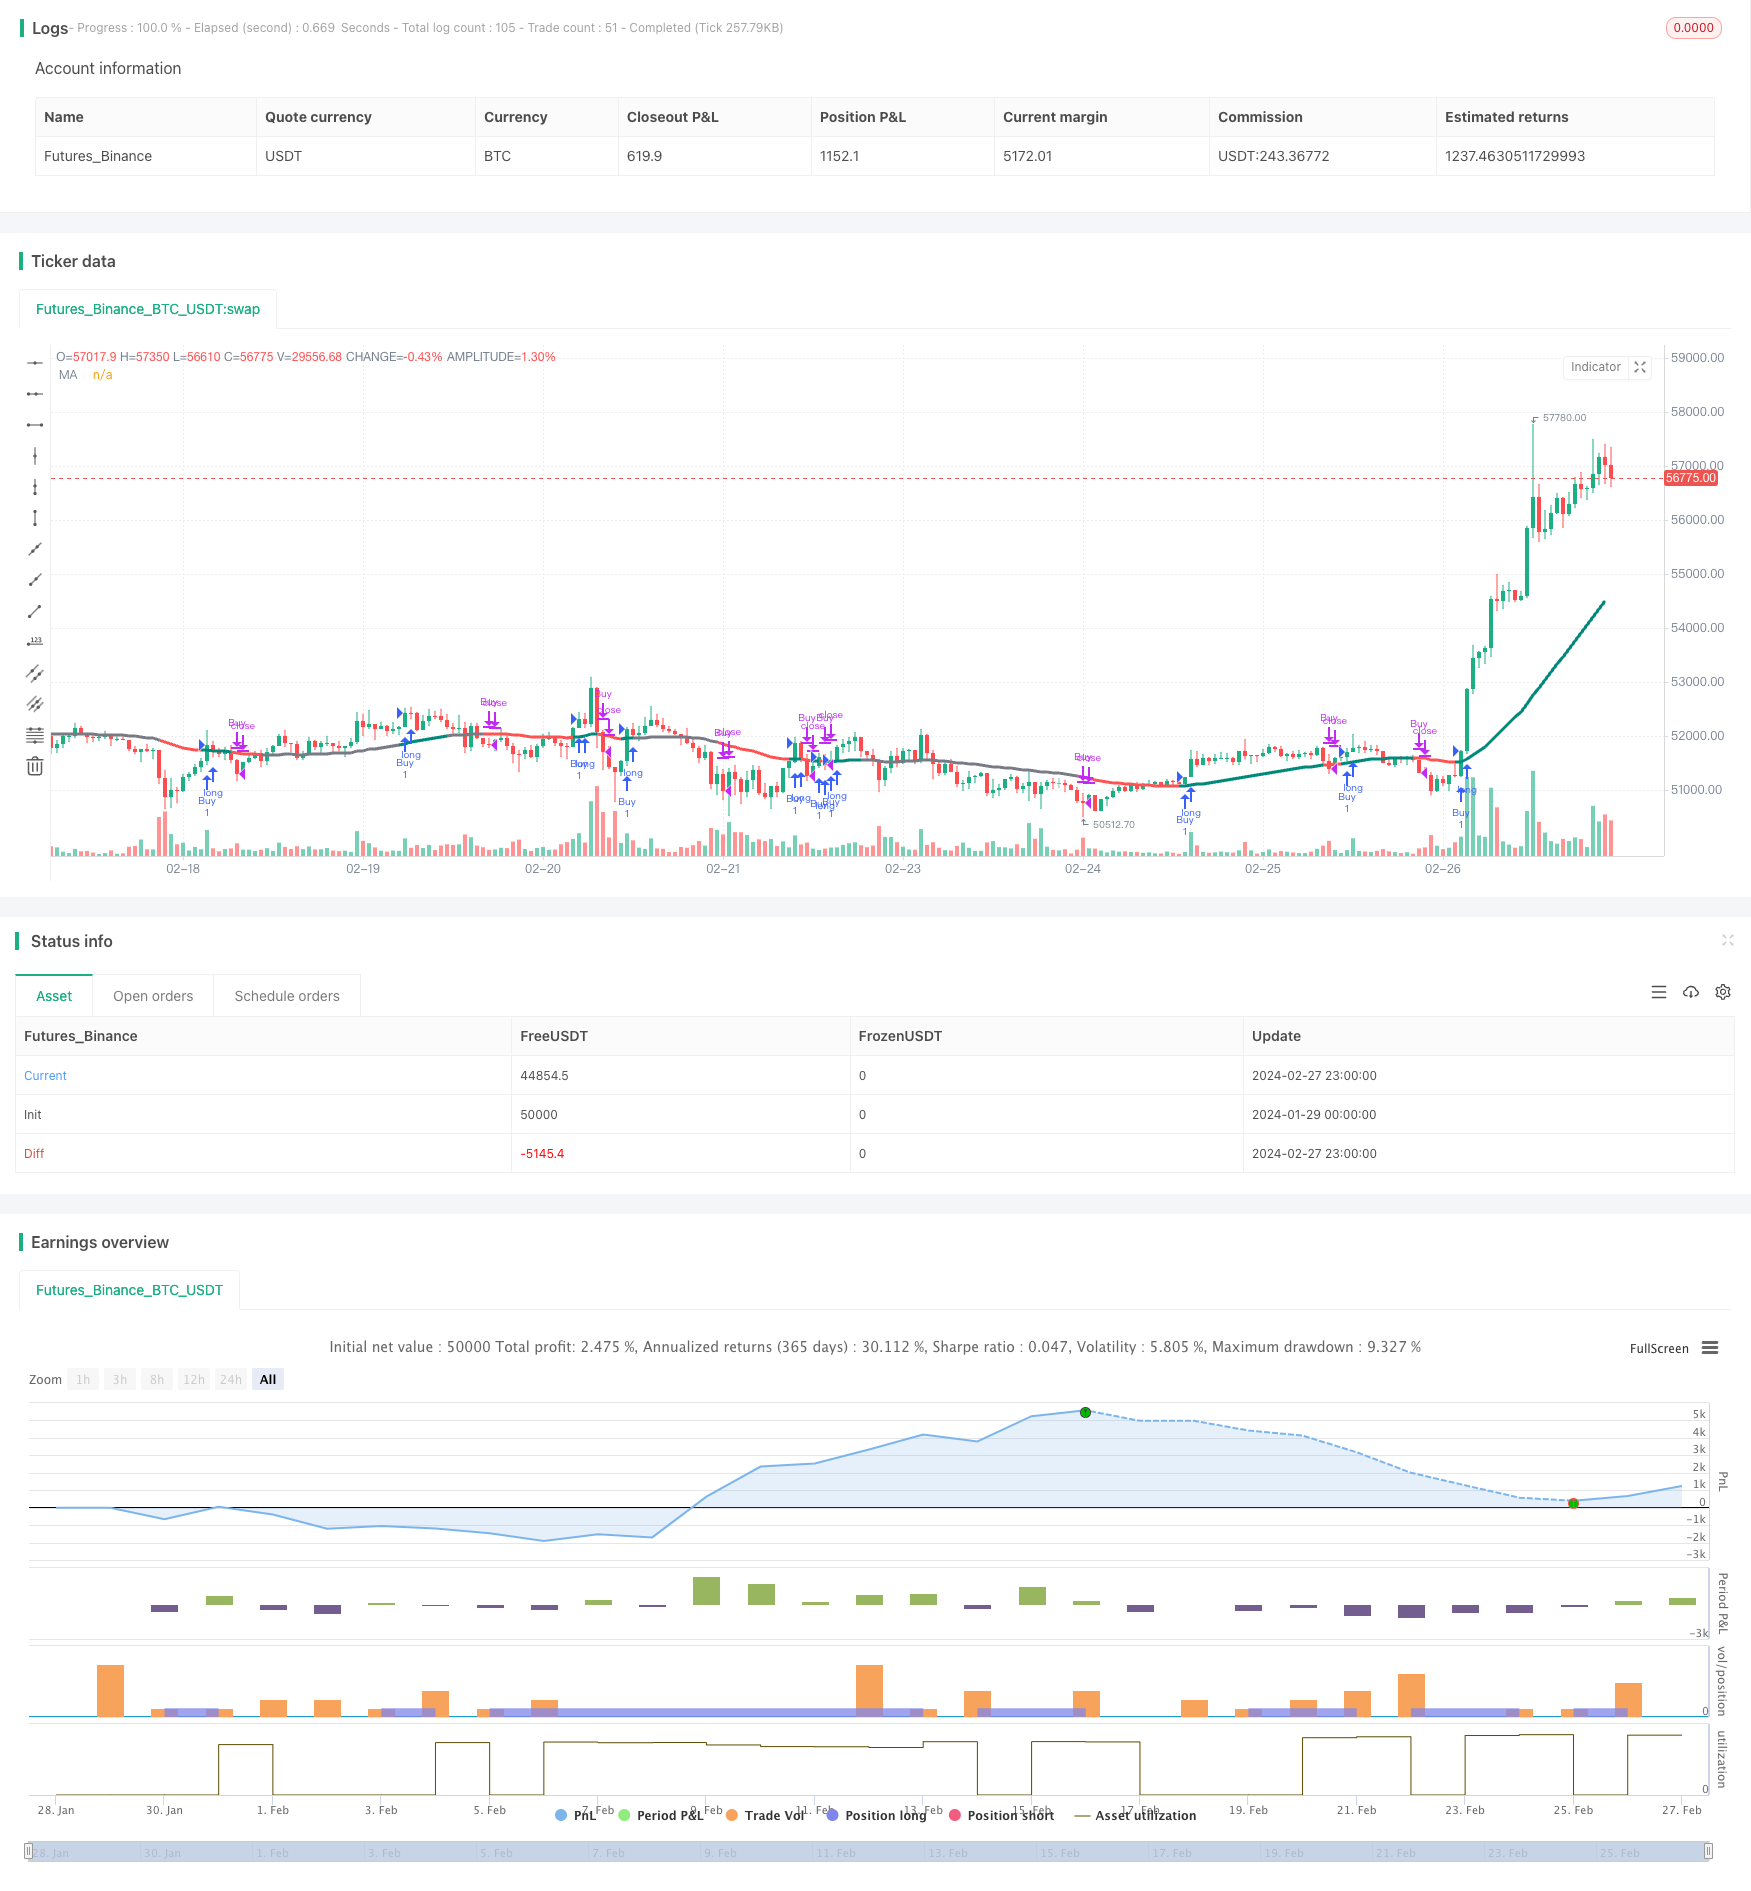
该策略结合移动平均线和ADX指数的优势,可有效识别趋势的存在和方向,减少错误信号。相比单一指标,该组合指标可提供更可靠的交易信号。
另外,该策略完全是基于参数计算的量化策略,回测效果好,实盘表现稳定,适合算法交易。
风险分析
该策略对市场大幅震荡时容易产生交易风险。当价格出现剧烈波动而指标未反应时,会给账户带来损失。此外,指标参数设置不当也会影响策略效果。
可通过止损来控制单笔损失。同时优化参数,并结合其他指标过滤来减少错误信号。
优化方向
该策略可以从以下几个方向进行优化:
结合其他指标过滤,如布林带、RSI等,提高信号质量
优化移动平均线和ADX指数的长度参数,寻找最优参数组合
增加止损机制,控制单笔损失
测试不同的持仓时间,寻找最佳持仓周期
总结
动量平均向导指数移动平均交叉策略,通过计算价格动量和趋势力度,可有效识别市场趋势方向,是一种可靠的趋势跟踪策略。该策略算法化程度高,回测稳定,实盘表现良好。通过继续优化,可望获得更好的策略效果。
策略源码
/*backtest
start: 2024-01-29 00:00:00
end: 2024-02-28 00:00:00
period: 1h
basePeriod: 15m
exchanges: [{"eid":"Futures_Binance","currency":"BTC_USDT"}]
*/

// © Julien_Eche

//@version=5
strategy("MA ADX Strategy", overlay=true, default_qty_type=strategy.percent_of_equity)

start_date = input(timestamp("1975-01-01T00:00:00"), title="Start Date")
end_date = input(timestamp("2099-01-01T00:00:00"), title="End Date")

// Indicator Inputs
group1 = "MA Parameters"
lengthMA = input.int(50, title="MA Length", minval=1, group=group1)
sourceMA = input(close, title="MA Source", group=group1)

group2 = "ADX Parameters"
diLength = input.int(14, title="DI Length", minval=1, group=group2)
adxSmoothing = input.int(14, title="ADX Smoothing", minval=1, maxval=50, group=group2)
adxMAActive = input.int(15, title="ADX MA Active", minval=1, group=group2)

// Directional Movement calculations
upwardMovement = ta.change(high)
downwardMovement = -ta.change(low)
trueRangeSmoothed = ta.rma(ta.atr(diLength), diLength)
positiveDM = fixnan(100 * ta.rma(upwardMovement > downwardMovement and upwardMovement > 0 ? upwardMovement : 0, diLength) / trueRangeSmoothed)
negativeDM = fixnan(100 * ta.rma(downwardMovement > upwardMovement and downwardMovement > 0 ? downwardMovement : 0, diLength) / trueRangeSmoothed)
dmSum = positiveDM + negativeDM

// Average Directional Index (ADX) calculation
averageDX = 100 * ta.rma(math.abs(positiveDM - negativeDM) / math.max(dmSum, 1), adxSmoothing)

// Line color determination
lineColor = averageDX > adxMAActive and positiveDM > negativeDM ? color.teal : averageDX > adxMAActive and positiveDM < negativeDM ? color.red : color.gray

// Moving Average (MA) calculation
maResult = ta.wma(sourceMA, lengthMA)

// Plotting the Moving Average with color
plot(maResult, color=lineColor, title="MA", linewidth=3)

// Strategy logic
if (averageDX > adxMAActive and positiveDM > negativeDM)
    strategy.entry("Buy", strategy.long)

if (averageDX > adxMAActive and positiveDM < negativeDM)
    strategy.close("Buy")