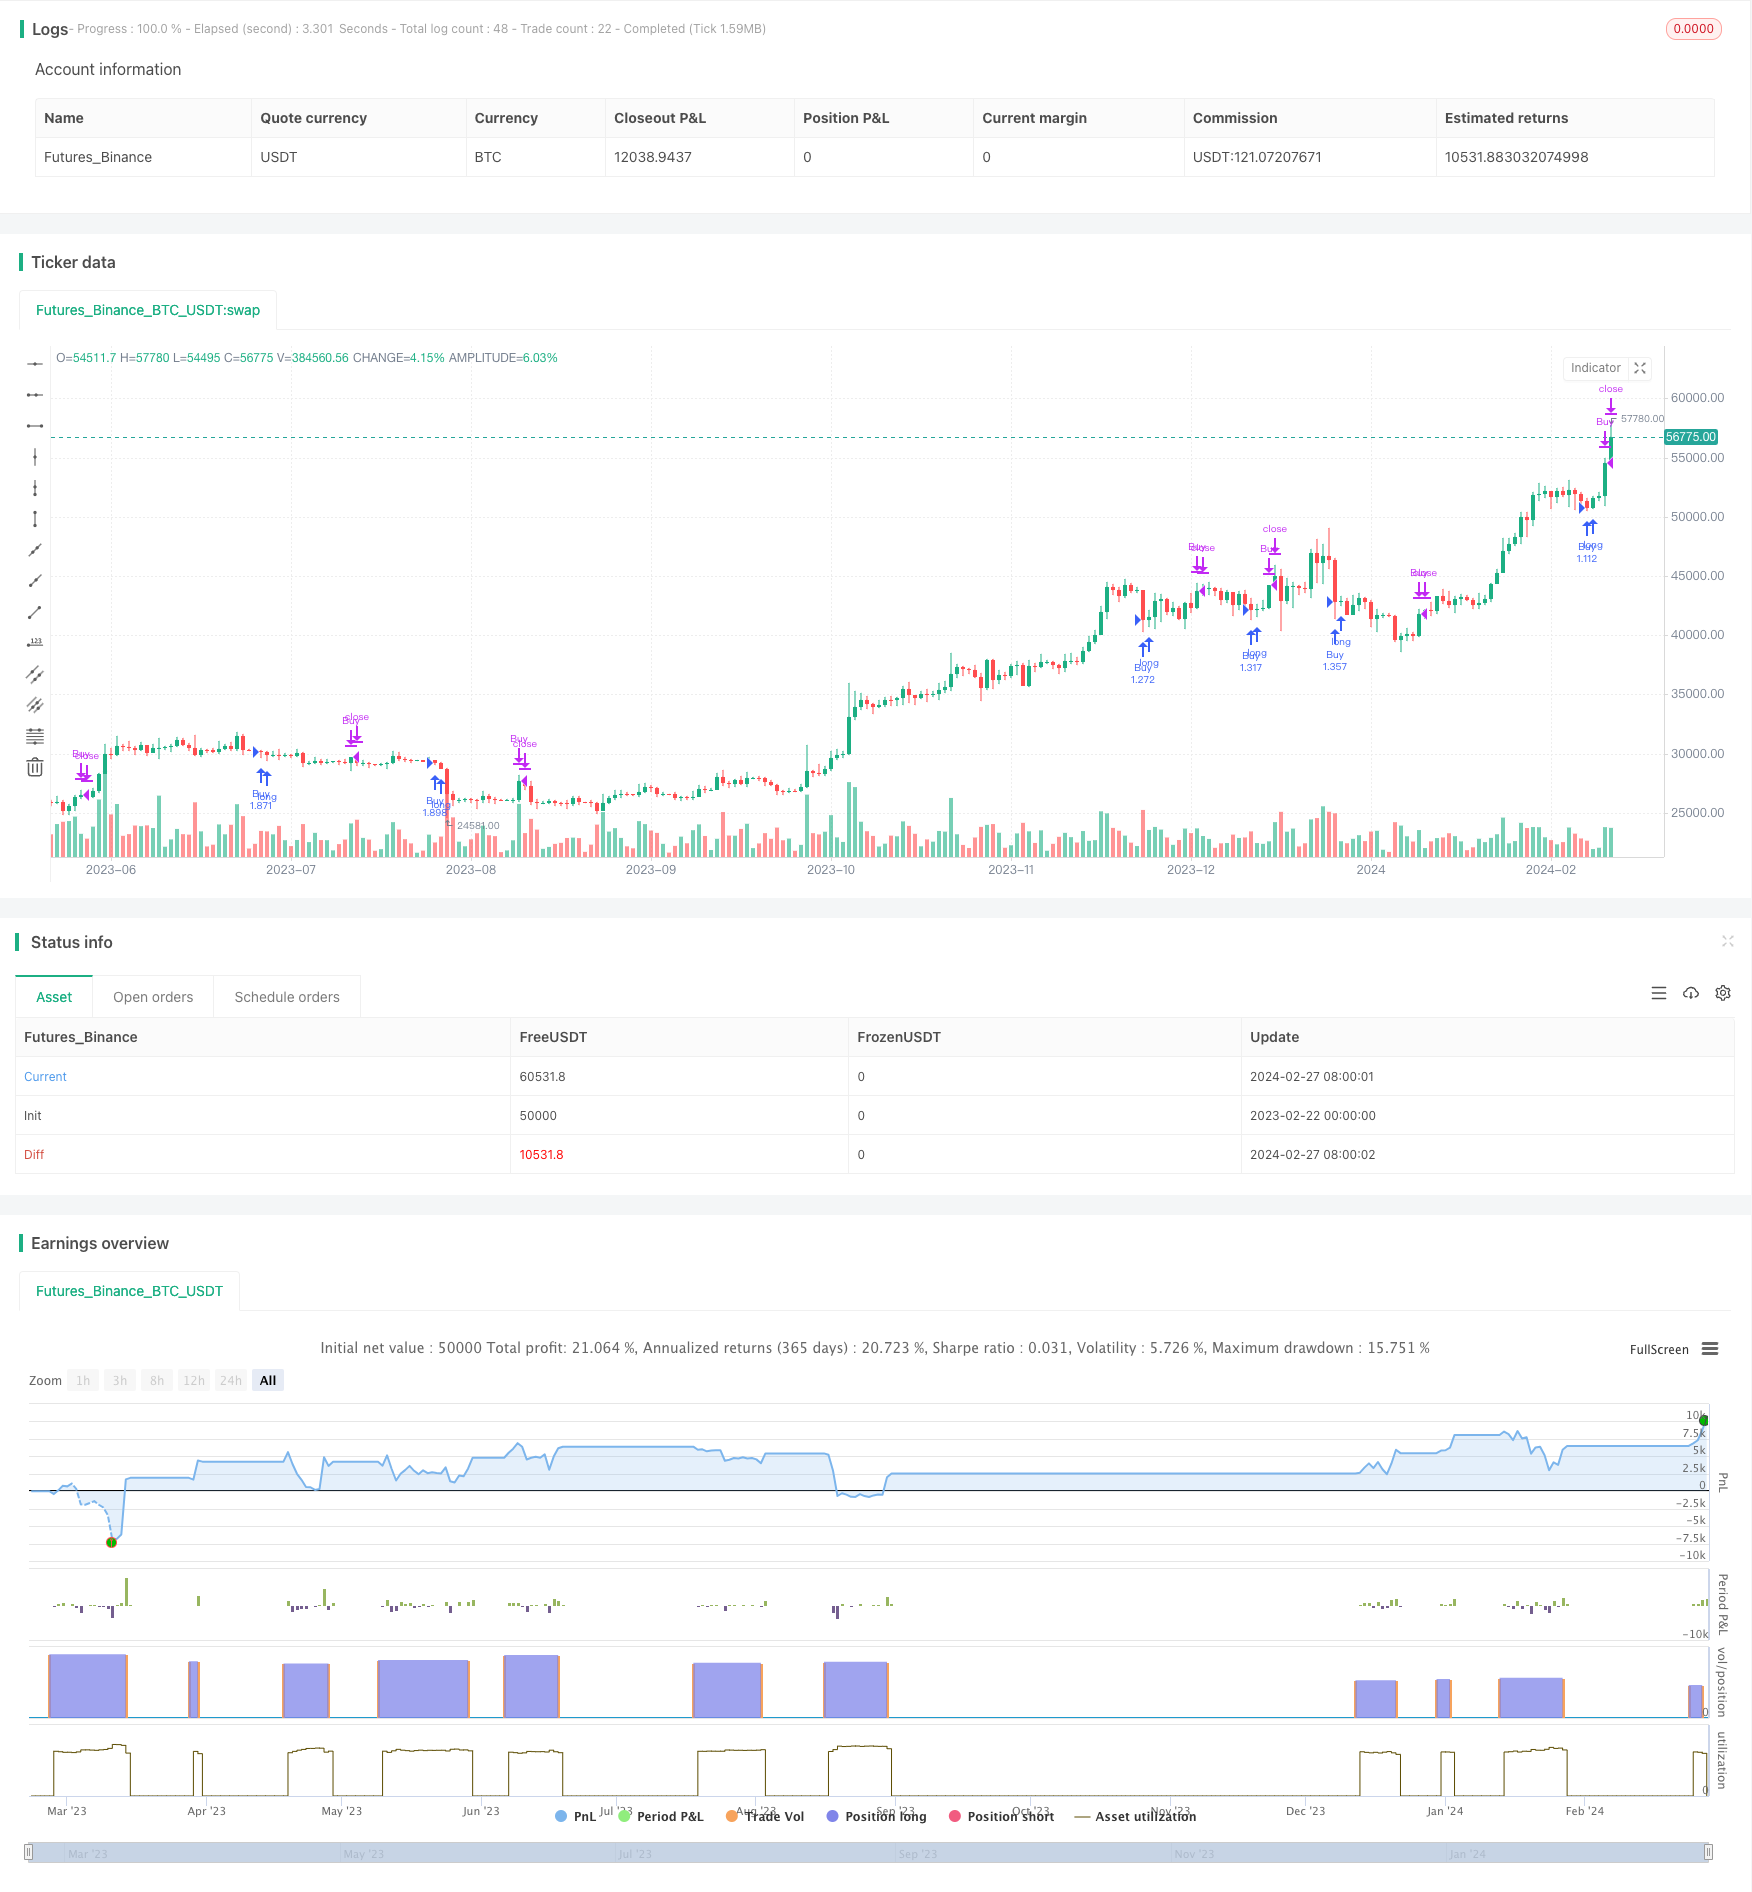
The Compound Breakout Strategy

Author: ChaoZhang, Date: 2024-02-29 14:07:54
Tags:

img

Overview

This strategy calculates the highest and lowest prices of recent N bars to set double breakout conditions combined with moving average line to implement low-buying and high-selling trading strategy.

Strategy Principles

The strategy is mainly based on the following principles:

  1. Calculate the minimum low price minLow of recent 7 bars to determine the breakout buy condition
  2. Calculate the maximum high price maxHigh of recent 7 bars to determine the breakout sell condition
  3. Calculate the 200-period simple moving average line mma to determine the trend direction combined with mma
  4. Buy condition: close price breaks through minLow and is higher than mma
  5. Sell condition: close price breaks through maxHigh or is higher than maxHigh

By calculating the extremes of recent N bars, it judges whether the market is extremely oversold or overbought. Combined with the moving average line to determine the trend direction, it sets double conditions to achieve the breakout trading strategy of low-buying and high-selling.

Advantage Analysis

The strategy has the following advantages:

  1. The double condition setting makes the trading signals of the strategy more reliable
  2. Using the extremes of K lines to judge the oversold and overbought status can seize the chance of reversal
  3. Combining the moving average line to determine the trend direction avoids reverse operations
  4. It implements the idea of low-buying and high-selling, which is consistent with the trading psychology of most traders
  5. The logic of the strategy is simple and clear, easy to understand and implement

Through double confirmation, the signal quality of the strategy is relatively high, and the space for parameter optimization is large, which is suitable for different market environments.

Risk Analysis

The strategy also has some risks:

  1. The double condition limit the frequency of signals, possibly missing some trading opportunities
  2. Improper settings of computing cycle for K line extremes may fail to accurately determine the oversold and overbought status
  3. Improper parameter settings of the moving average line may incorrectly determine the trend direction
  4. It needs to optimize multiple parameters simultaneously, making parameter optimization more difficult

These risks can be reduced by adjusting computing cycles, optimizing parameter combinations and other methods. In addition, considering combining with other indicators for optimization.

Optimization Directions

The strategy can be mainly optimized in the following directions:

  1. Optimize the computing cycle of K line extremes to find the most appropriate cycle parameters to determine overbought and oversold
  2. Test the effects of moving average lines of different lengths
  3. Increase other combined indicators such as BOLL channels, KD indicators, etc.
  4. Increase stop loss strategies to control single stop loss
  5. Optimize entry and exit conditions to improve signal quality

Through parameter optimization, indicator optimization, risk control optimization and other means, the profit factor of the strategy can be greatly improved.

Summary

In general, this is a very practical breakout strategy. Calculating extremes of K lines to determine oversold and overbought status, using moving average line to determine trend direction, setting double filtering conditions to filter false signals, it implements high-quality low-buying and high-selling strategies. By optimizing computing cycles, adding other indicators and other means, the strategy effect can be further enhanced. The strategy is suitable for both beginners to learn and professional traders to optimize and use.


/*backtest
start: 2023-02-22 00:00:00
end: 2024-02-28 00:00:00
period: 1d
basePeriod: 1h
exchanges: [{"eid":"Futures_Binance","currency":"BTC_USDT"}]
*/

//@version=4
strategy("Larry Connors por RON", overlay=true, default_qty_type=strategy.percent_of_equity, default_qty_value=100)

value1 = input(7, title="Quantity of day low")
value2 = input(7, title="Quantity of day high")
entry = lowest(close[1], value1)
exit = highest(close[1], value2)

lengthMMA = input(200, title="Length of SMA", minval=1)
mma = sma(close, lengthMMA)

// Calcular el mínimo de los precios bajos de las últimas 'value1' velas
minLow = lowest(low, value1)

// Calcular el máximo de los precios altos de las últimas 'value2' velas
maxHigh = highest(high, value2)

// Test Period
testStartYear = input(2009, "Backtest Start Year")
testStartMonth = input(1, "Backtest Start Month")
testStartDay = input(2, "Backtest Start Day")
testPeriodStart = timestamp(testStartYear, testStartMonth, testStartDay, 0, 0)

testStopYear = input(2020, "Backtest Stop Year")
testStopMonth = input(12, "Backtest Stop Month")
testStopDay = input(30, "Backtest Stop Day")
testPeriodStop = timestamp(testStopYear, testStopMonth, testStopDay, 0, 0)

testPeriod() => true

if testPeriod()
    // Condiciones de entrada
    conditionMet = (close > mma) and (close < entry) and (low == minLow)
    strategy.entry("Buy", strategy.long, when=conditionMet)
    
    if conditionMet
        label.new(bar_index, entry, text="↑", style=label.style_arrowup, color=color.green, size=size.small, yloc=yloc.belowbar)
    
    // Condiciones de salida
    conditionExit = close > exit or close > maxHigh
    strategy.close("Buy", when=conditionExit)


More