概述
该策略是基于EMA均线和RSI、ATR指标构建的一个长线趋势跟踪策略。策略利用快慢EMA形成金叉死叉信号,结合长线EMA判断趋势方向,利用RSI和ATR对盘整进行过滤,实现对长线趋势的跟踪。
策略原理
- 快慢EMA(20日EMA和50日EMA)金叉做多,死叉做空
- 200日EMA判断长线趋势方向,只在趋势方向交易
- RSI低位做多,高位做空
- ATR来判断盘整,过滤假突破
优势分析
- 使用快慢EMA组合实现对趋势的判断
- 加入长EMA过滤,避免逆势交易
- RSI指标过滤超买超卖区域,避免追高杀跌
- ATR指标判断盘整,过滤震荡盘整的假突破
风险分析
- 长线看涨期间,存在一定程度的无法跟踪上涨趋势的风险
- EMA指标在盘整时易产生噪音,需要结合ATR指标过滤
- RSI和ATR参数设置需要根据不同品种分别测试优化
优化方向
- EMA长度的参数可进行优化,找到不同品种更匹配的组合
- RSI和ATR参数也可进行优化,提高对盘整的识别能力
- 可考虑加入移动止损,锁定部分利润,控制风险
总结
该策略整体来说是一个以EMA为核心的长线趋势跟踪策略,同时引入RSI和ATR指标进行辅助,可以较好地识别趋势方向并过滤噪音。通过参数的优化,该策略可以适用于更多品种,在长线看涨环境中可以获得不错的效果。
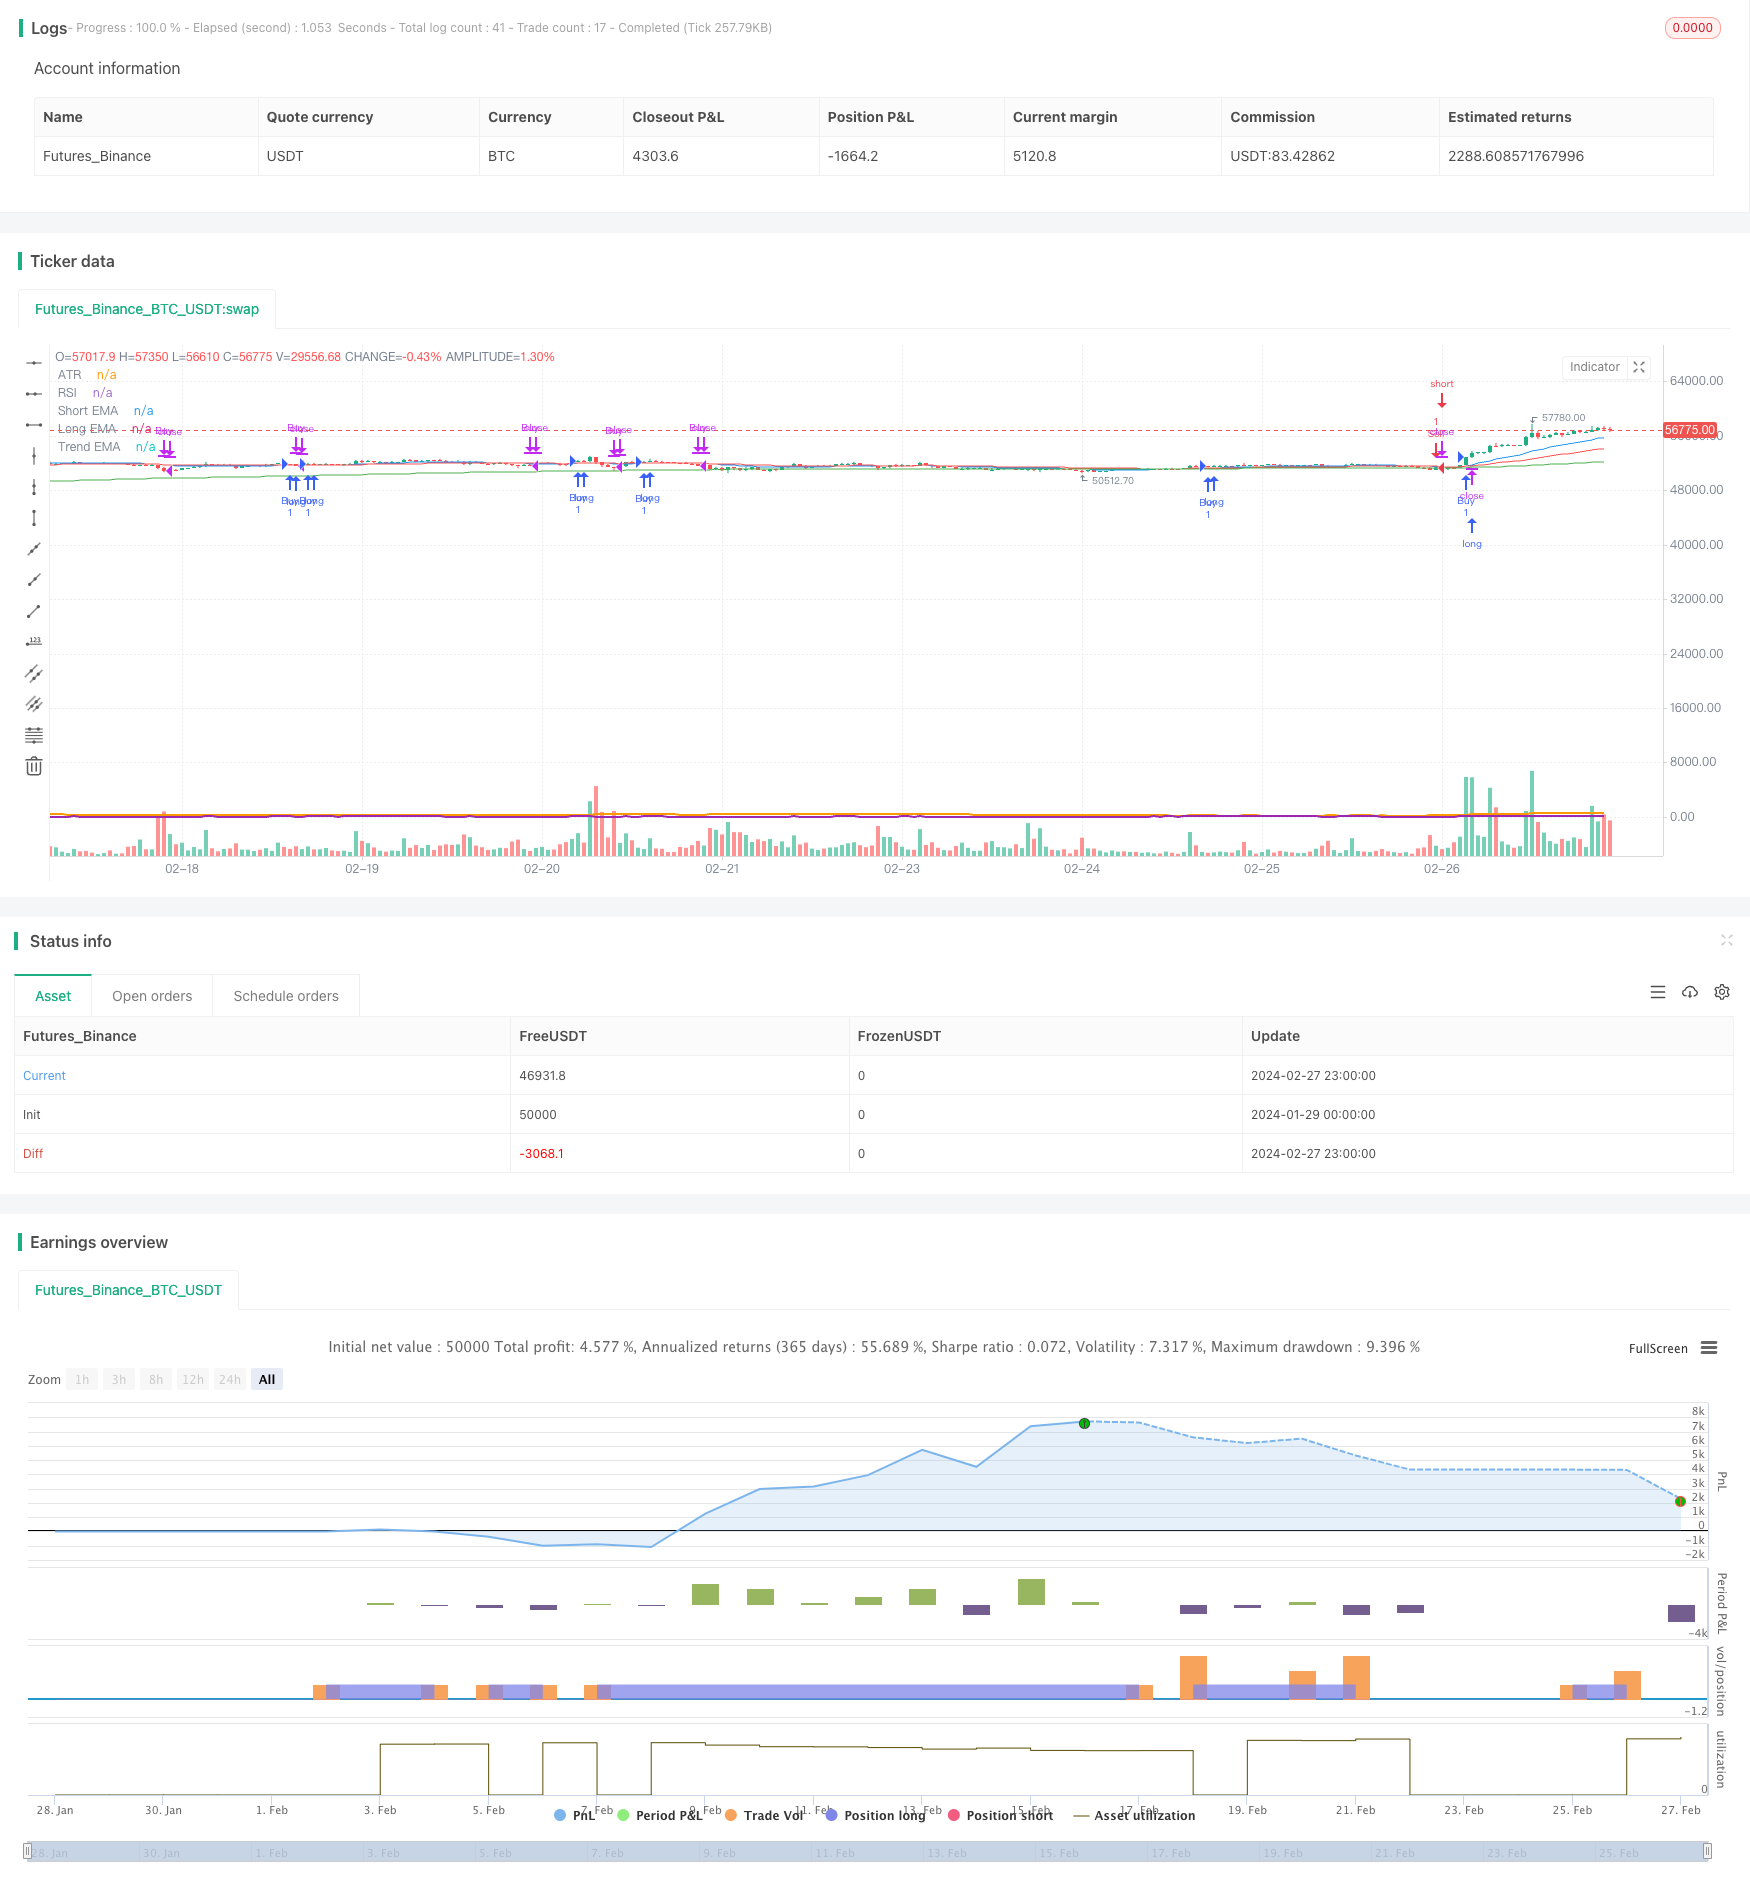
策略源码
/*backtest
start: 2024-01-29 00:00:00
end: 2024-02-28 00:00:00
period: 1h
basePeriod: 15m
exchanges: [{"eid":"Futures_Binance","currency":"BTC_USDT"}]
*/

//@version=5
strategy("EMA Strategy with Trend Filter", overlay=true)

// Параметры EMA
shortEmaLength = input(20, title="Short EMA")
longEmaLength = input(50, title="Long EMA")
trendEmaLength = input(200, title="Trend EMA")
shortEma = ta.ema(close, shortEmaLength)
longEma = ta.ema(close, longEmaLength)
trendEma = ta.ema(close, trendEmaLength)

// Параметры RSI
rsiLength = input(14, title="RSI Length")
rsi = ta.rsi(close, rsiLength)

// Параметры ATR
atrLength = input(14, title="ATR Length")
atr = ta.atr(atrLength)

// Логика для сигналов покупки и продажи с фильтром по тренду
buySignal = ta.crossover(shortEma, longEma) and close > trendEma
sellSignal = ta.crossunder(shortEma, longEma) and close < trendEma

// Вход в сделки
if (buySignal)
    strategy.entry("Buy", strategy.long)

if (sellSignal)
    strategy.entry("Sell", strategy.short)

// Выход из сделок на основе EMA пересечений
exitBuySignal = ta.crossunder(shortEma, longEma)
exitSellSignal = ta.crossover(shortEma, longEma)

if (exitBuySignal)
    strategy.close("Buy")

if (exitSellSignal)
    strategy.close("Sell")

// Визуализация EMA
plot(shortEma, color=color.blue, title="Short EMA")
plot(longEma, color=color.red, title="Long EMA")
plot(trendEma, color=color.green, title="Trend EMA")

// Отдельная панель для RSI и его визуализация
plot(rsi, title="RSI", color=color.purple, linewidth=2)

// Отдельная панель для ATR и его визуализация
plot(atr, title="ATR", color=color.orange, linewidth=2)