概述
该策略基于VWAP和EMA作为判断趋势方向的指标,VWAP代表典型价格,EMA200代表中长线趋势。当价格高于VWAP和EMA200时做多,低于VWAP和EMA200时做空,属于典型的趋势跟随策略。
策略原理
策略的核心逻辑在于使用VWAP和EMA判断价格趋势。
- VWAP代表价格的典型价格,能反映市场参与者的平均成本。价格高于VWAP时代表着买方力量增加,做多;价格低于VWAP时,代表卖方的力量增强,应当做空。
- EMA200代表价格的中长线趋势走向。价格在EMA200之上代表着中长线看涨,应当做多;价格在EMA200之下时代表着中长线看跌,应当做空。
因此,该策略首先判断价格是否同时高于VWAP和EMA200,如果是则做多;如果价格同时低于VWAP和EMA200,则做空。可以看出,该策略主要依靠VWAP和EMA判断买卖决策。
此外,策略还设置了止盈止损点。做多后设置止盈为进入价的3.5%,止损为1.4%;做空后设置止盈为进入价的2.5%,止损为0.9%。这可以避免过大的亏损。
策略优势
该策略最大的优势在于利用VWAP和EMA判断趋势非常可靠。
- VWAP能准确反映市场参与者的平均成本,是判断趋势非常好的指标;
- EMA200能清晰反映中长线趋势,判断大趋势的方向十分准确可靠。
因此,结合使用VWAP和EMA判断趋势可靠性非常高。当两者判断趋势一致时,做出操作的成功率很高。
此外,设置止盈止损点,可以避免单笔亏损过大。
策略风险
该策略主要的风险在于VWAP和EMA可能发出错误信号。
- 当市场出现剧烈波动时,价格可能短期脱离VWAP,发出错误信号。
- 当新的趋势才刚刚开始时,EMA可能滞后于价格变化,使得策略错过最佳入场时机。
此外,止盈止损设置可能不当,单笔亏损过大的风险依然存在。
为解决上述问题,我们可以对VWAP和EMA的参数设置进行优化,使它们更好地判别新的趋势的开始。同时可以设置自适应的止盈止损,让止盈止损随价格波动做出调整。
策略优化方向
该策略主要可以从以下几个方面进行优化:
- 对VWAP参数进行优化,找到更稳定判断趋势的VWAP参数组合。
- 对EMA周期进行优化,找到判断趋势更准确的EMA参数。
- 增加其他判别趋势的指标,如布林带,KDJ等与VWAP和EMA组合,提高判断准确性。
- 设置自适应止盈止损。按一定规则让止盈止损水平随价格波动进行调整,避免止盈止损过于死板。
- 结合仓位管理。根据回撤、连亏次数等指标调整仓位大小,控制策略整体风险。
总结
该策略整体是一个非常可靠的趋势跟随策略。它利用VWAP和EMA判断趋势方向,思路清晰简单,当两者发出一致信号时,入场的成功概率很大。通过合理设置止盈止损,可以控制风险。我们仍然可以通过多种方式(参数优化、增加指标、自适应止盈止损、仓位管理等)来进一步完善该策略,使其业绩更加优异。
策略源码
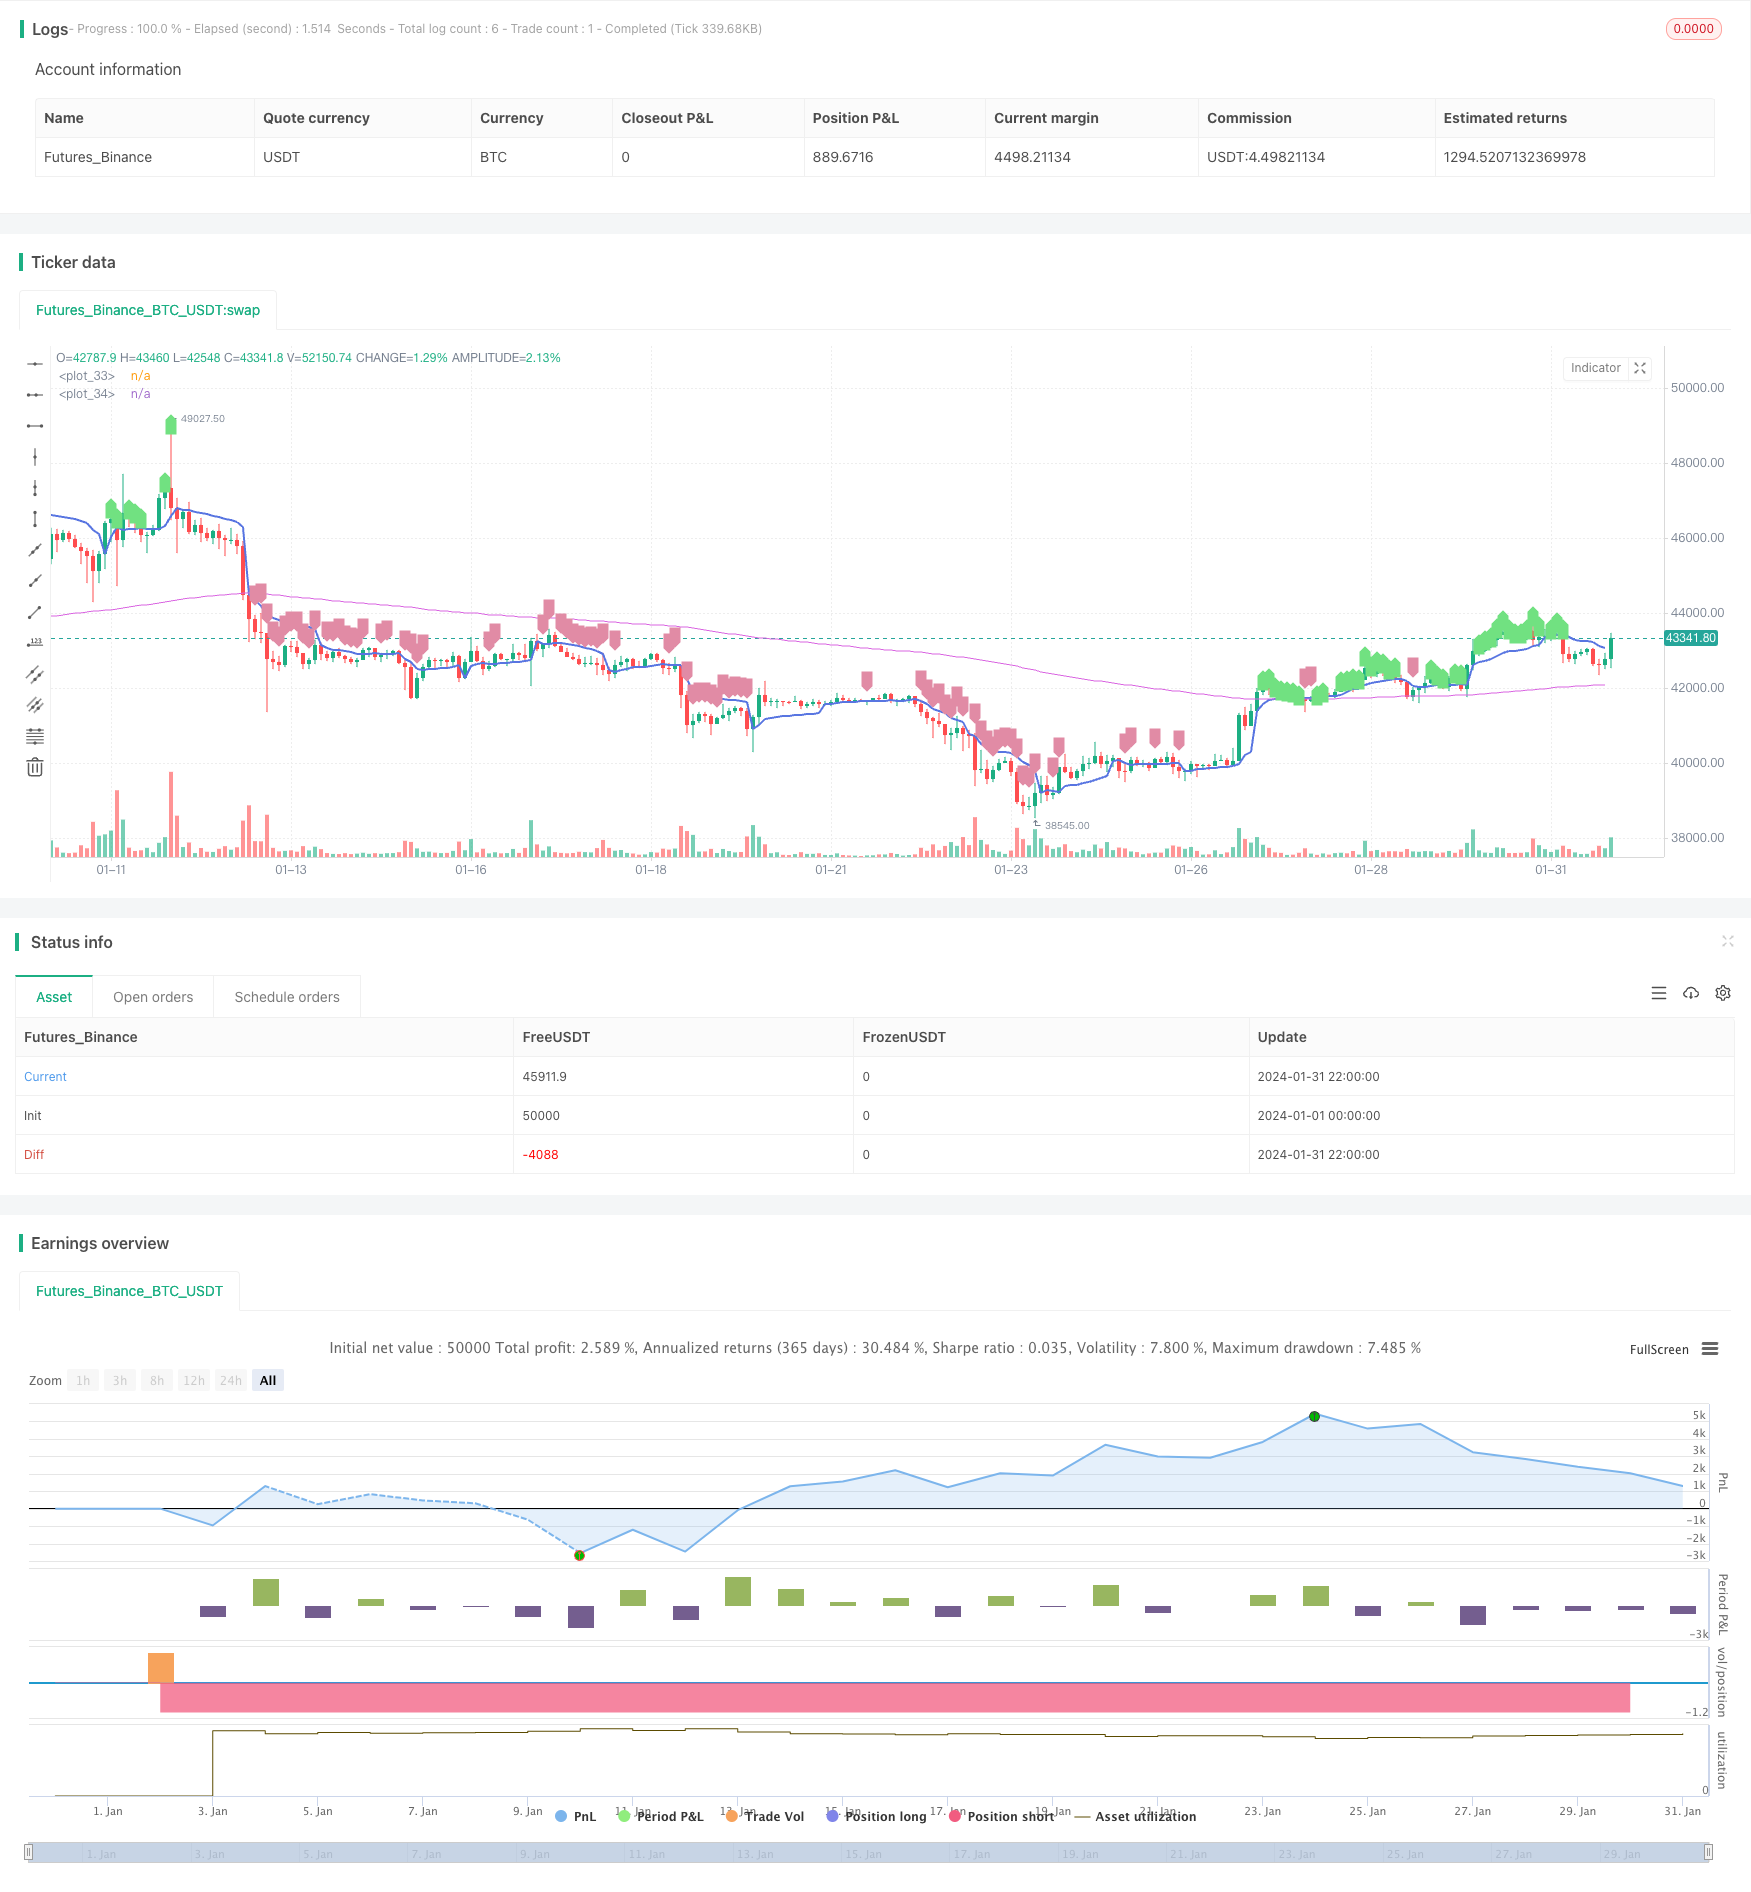
/*backtest
start: 2024-01-01 00:00:00
end: 2024-01-31 23:59:59
period: 2h
basePeriod: 15m
exchanges: [{"eid":"Futures_Binance","currency":"BTC_USDT"}]
*/

//26m Binance BTCUSDTPERP
//@version=4
strategy("VWAP Trend Follower", initial_capital=100, overlay=true, commission_type=strategy.commission.percent, commission_value=0.04, default_qty_type = strategy.percent_of_equity, default_qty_value = 90, currency = currency.USD )

/// INITIALISE STRATEGY ///
price=close[1]
vprice=vwap(price)
trend=ema(price, 200)

/// RISK MANAGEMENT ///
long_tp_inp = input(3.5, title='Long Take Profit %',step=0.1)/100
long_sl_inp = input(1.4, title='Long Stop Loss %',step=0.1)/100
short_tp_inp = input(2.5, title='Short Take Profit %',step=0.1)/100
short_sl_inp = input(0.9, title='Short Stop Loss %',step=0.1)/100
long_take_level = strategy.position_avg_price * (1 + long_tp_inp)
long_stop_level = strategy.position_avg_price * (1 - long_sl_inp)
short_take_level = strategy.position_avg_price * (1 - short_tp_inp)
short_stop_level = strategy.position_avg_price * (1 + short_sl_inp)
//long_trailing = input(5, title='Trailing Stop Long',step=0.1) / 100
//short_trailing = input(5, title='Trailing Stop short',step=0.1) / 100

/// STRATEGY CONDITIONS ///
aLong= price > trend and price > vprice
entry_long = aLong and aLong[2] and aLong[1]
aShort= price < trend and price < vprice
entry_short = aShort and aShort[2] and aShort[1]
//exit_long =
//exit_short =
//entry_price_long=valuewhen(entry_long,close,0)
//entry_price_short=valuewhen(entry_short,close,0)

/// PLOTTING ///
plot(vprice,                color=#5875E1, linewidth=2)
plot(trend,                 color=#D965E1, linewidth=1)
plotshape(series=aLong,     color=#71E181,style=shape.labelup)
plotshape(series=aShort,    color=#E18BA5,style=shape.labeldown)
//plot(long_take_level,     color=#00E676, linewidth=2)
//plot(long_stop_level,     color=#FF5252, linewidth=1)
//plot(short_take_level,    color=#4CAF50, linewidth=2)
//plot(short_stop_level,    color=#FF5252, linewidth=1)

/// PERIOD ///
testStartYear   = input(2019, "Backtest Start Year")
testStartMonth  = input(1, "Backtest Start Month")
testStartDay    = input(1, "Backtest Start Day")
testPeriodStart = timestamp(testStartYear,testStartMonth,testStartDay,0,0)
testStopYear    = input(2020, "Backtest Stop Year")
testStopMonth   = input(12, "Backtest Stop Month")
testStopDay     = input(31, "Backtest Stop Day")
testPeriodStop  = timestamp(testStopYear,testStopMonth,testStopDay,0,0)
testPeriod() => true

//// STRATEGY EXECUTION ////

if testPeriod()
    if strategy.position_size == 0 or strategy.position_size > 0
        strategy.entry(id="Long", long=true, when=entry_long, comment="Long")
        strategy.exit("Take Profit/ Stop Loss","Long", limit=long_take_level, stop=long_stop_level,comment="Exit Long")//,trail_points=entry_price_long * long_trailing / syminfo.mintick, trail_offset=entry_price_long * long_trailing / syminfo.mintick)
//        strategy.close(id="Long", when=exit_long, comment = "Exit Long")

    if strategy.position_size == 0 or strategy.position_size < 0
        strategy.entry(id="Short", long=false, when=entry_short, comment = "Short")
        strategy.exit("Take Profit/ Stop Loss","Short", limit=short_take_level , stop=short_stop_level,comment = "Exit Short")//, trail_points=entry_price_short * short_trailing / syminfo.mintick, trail_offset=entry_price_short * short_trailing / syminfo.mintick)
//        strategy.close(id="Short", when=exit_short, comment = "Exit Short")