本文将详细分析一种基于200日移动平均线与价格距离的趋势追踪型策略,称为“坚果离线趋势追踪策略”。该策略通过追踪价格与200日移动平均线的距离,在超过设定阈值时建立部位,达到获利目标后平仓离场。
一、策略原理
该策略的核心指标是200日指数移动平均线(200 EMA)。策略判断价格是否偏离200日线达到设定百分比后,在最近一根K线为阳线(多头入场)或阴线(空头入场)时建立部位。多头入场条件为价格低于200日线且价格与200日线距离百分比大于阈值,并在最近一根K线收阳线时入场做多;空头入场条件为价格高于200日线且价格与200日线距离百分比大于阈值,并在最近一根K线收阴线时入场做空。
出场条件为价格回归到200日线时或达到止盈目标(入场价1.5倍)时平仓离场。设定止损为期权申报价值的20%。
详细的入场、出场条件如下:
多头入场: 收盘价<200日线 并且 收盘价与200日线距离百分比≥阈值 并且 最近一根K线收阳线
空头入场: 收盘价>200日线 并且 收盘价与200日线距离百分比≥阈值 并且 最近一根K线收阴线
多头出场: 收盘价≥200日线 或 达到止盈目标 或 交易日结束
空头出场: 收盘价<=200日线 或 达到止盈目标 或 交易日结束
止损条件为期权申报价值的20%。
二、策略优势
该策略主要具有以下优势:
- 使用200日移动平均线判断价格中长线趋势方向,避免被短期市场噪音干扰
- 建立趋势追踪机制,跟踪中长线价格趋势
- 优化入场时机判断,最后一个K线方向与大趋势一致时入场
- 合理止损和止盈机制,避免亏损扩大
三、策略风险
该策略主要存在以下风险:
- 大盘震荡期价格可能多次触碰移动平均线造成多次亏损
- 趋势突然反转造成止损退出
- 设定的参数例如移动平均线周期选择不当,无法准确判断趋势
为降低上述风险,可以优化如下几个方面:
- 调整移动平均线参数,或加入其他指标判断大趋势
- 优化止损机制,例如随价格变化调整止损距离
- 优化入场条件,加入更多判断指标
四、策略优化方向
该策略主要可从以下几个方面进行优化:
- 优化移动平均线参数,测试不同周期参数对策略效果的影响
- 增加其他指标判断大趋势,如布林线通道、KDJ指标等
- 调整止损策略,使止损水平能根据行情变化而动态调整
- 优化入场条件,避免因短期调整而错误入场
五、总结
本文详细分析了基于价格与200日移动平均线距离的趋势追踪策略的原理、优势、风险与优化方向。该策略通过追踪价格与长期均线的距离来判断中长线趋势方向,在价格达到超过均线一定阈值时建仓追踪趋势,退出条件为止损或止盈触发。该策略能很好地跟踪中长期价格趋势,但也存在一定的参数优化空间。未来可从多个方面继续完善该策略,使之能够在更多不同行情下获得稳定收益。
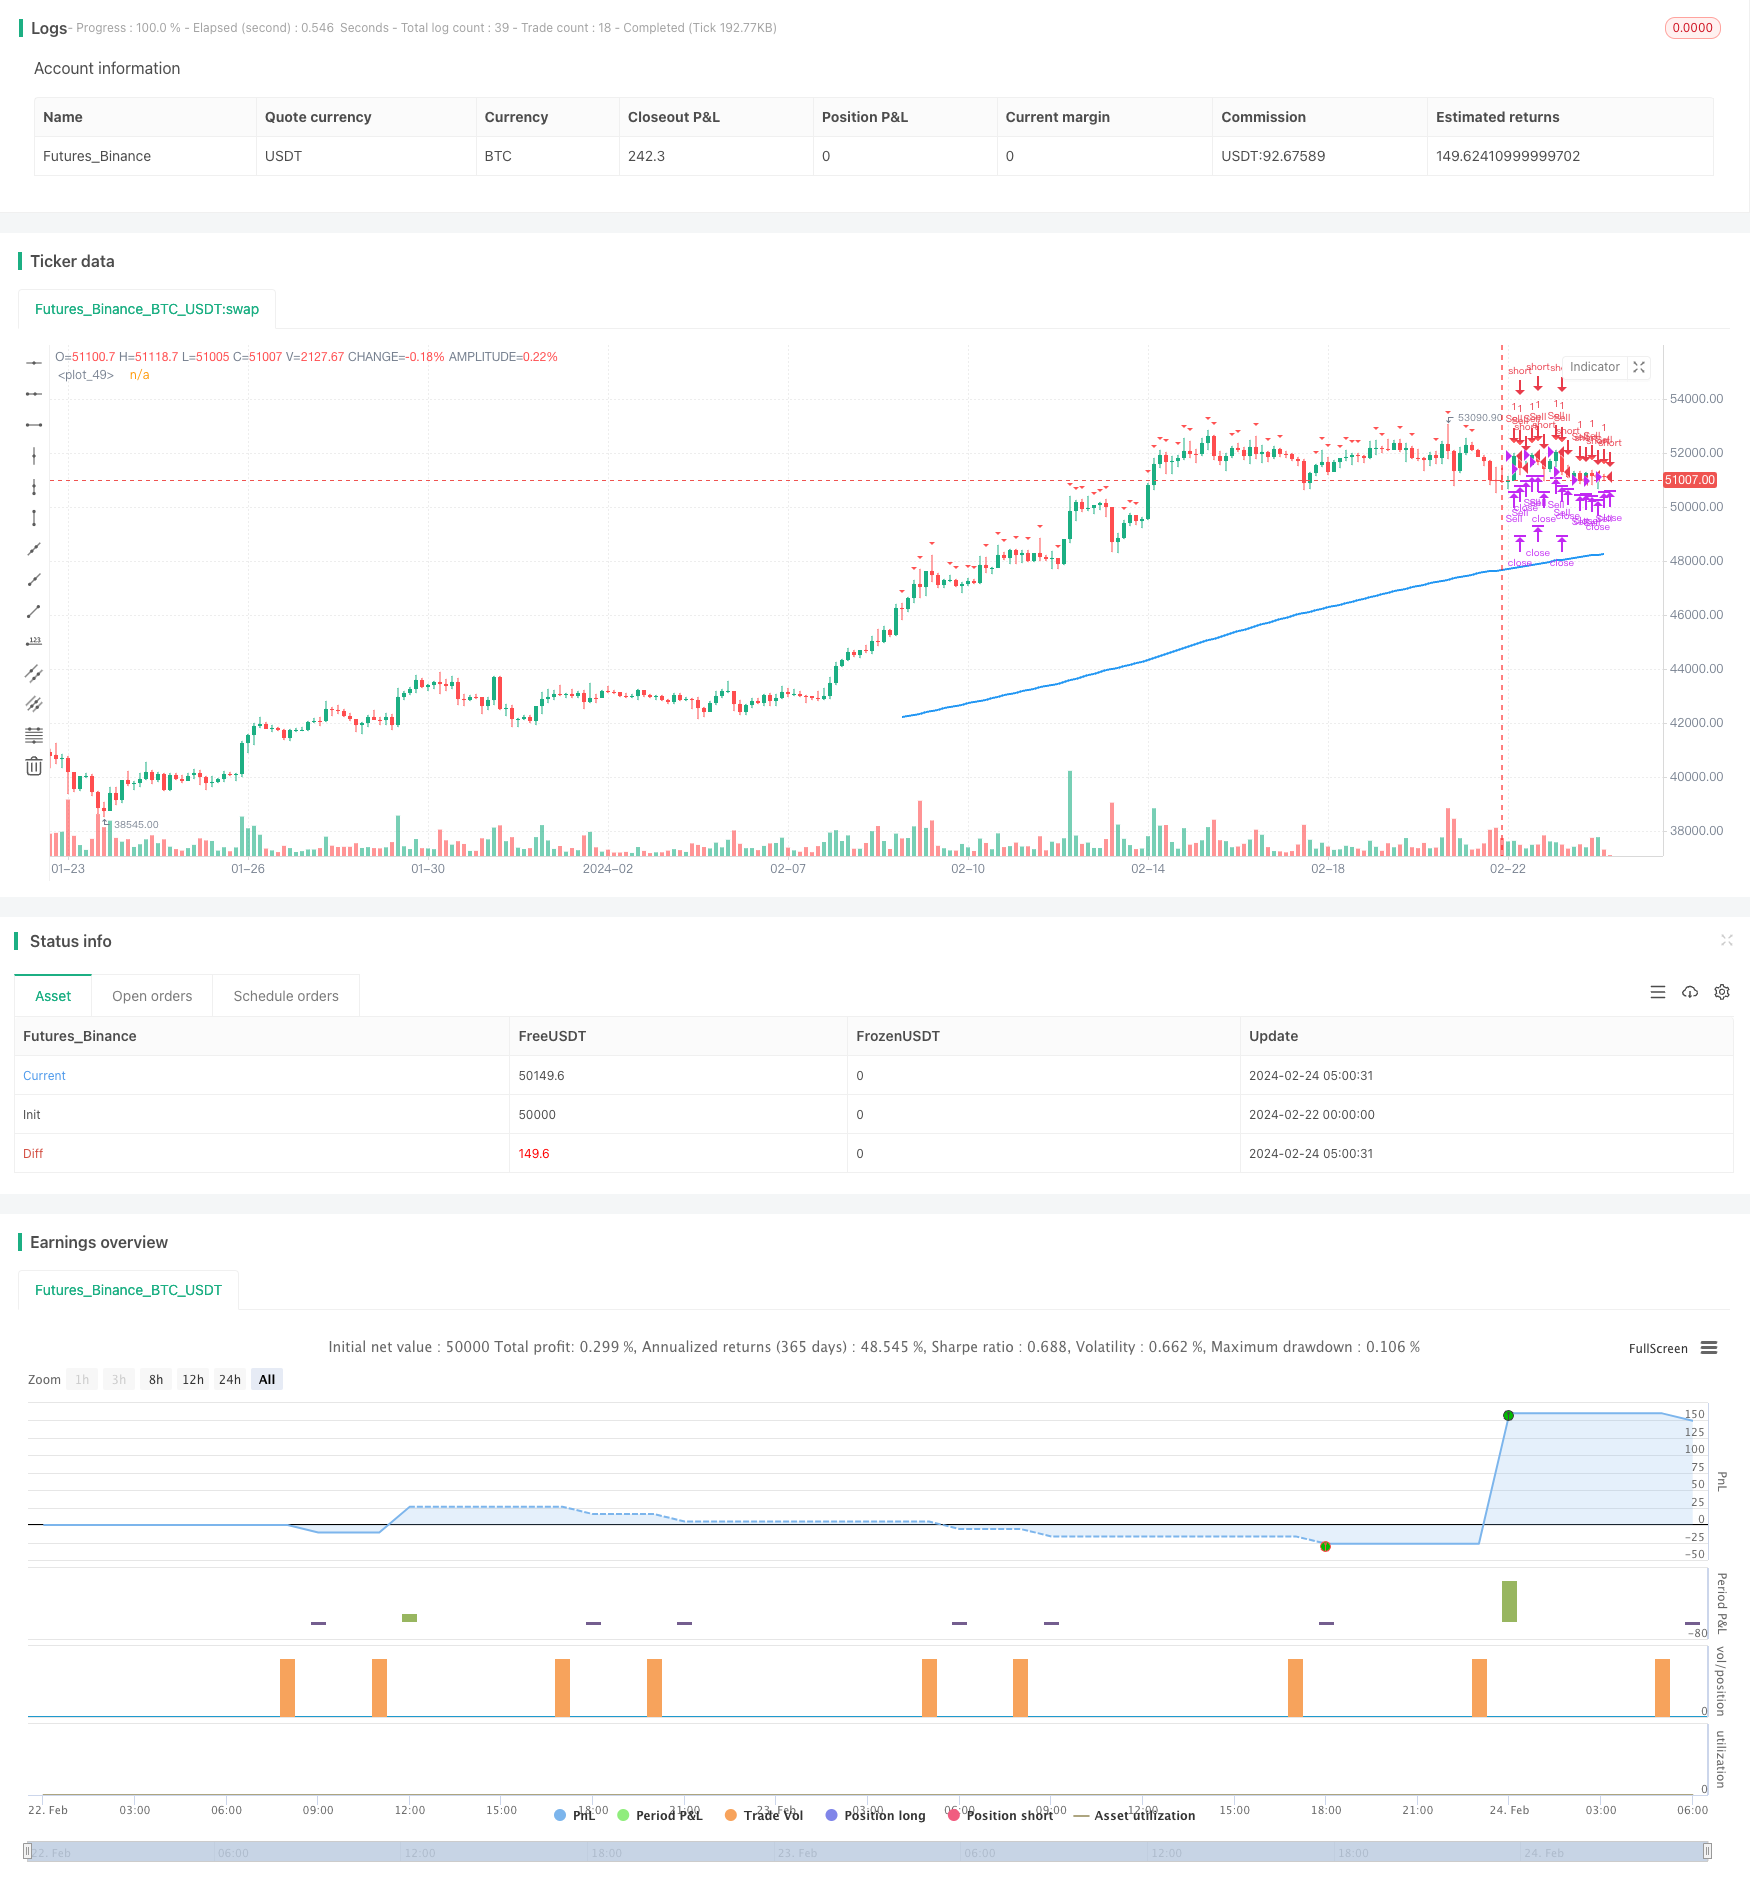
/*backtest
start: 2024-02-22 00:00:00
end: 2024-02-24 06:00:00
period: 3h
basePeriod: 15m
exchanges: [{"eid":"Futures_Binance","currency":"BTC_USDT"}]
*/

//@version=4
strategy("Intraday Price Away from 200 EMA Strategy", overlay=true)

// Define inputs
emaPeriod = input(200, title="EMA Period")
thresholdPercent = input(0.75, title="Threshold Percent", minval=0)  // Define the threshold percentage

// Calculate 200 EMA
ema = ema(close, emaPeriod)

// Calculate distance from 200 EMA as a percentage
distance_percent = ((close - ema) / ema) * 100

// Track average entry price
var float avgEntryPrice = na

// Buy conditions
buy_condition = close < ema and abs(distance_percent) >= thresholdPercent and close[1] < close[2]

// Exit conditions for buy
exit_buy_condition = close >= ema or time_close(timeframe.period) or (avgEntryPrice * 1.5) <= close

// Sell conditions
sell_condition = close > ema and abs(distance_percent) >= thresholdPercent and close[1] > close[2]

// Exit conditions for sell
exit_sell_condition = close <= ema or time_close(timeframe.period) or (avgEntryPrice * 1.5) >= close

// Execute buy and sell orders only if there are no open trades
if strategy.opentrades == 0
    strategy.entry("Buy", strategy.long, when=buy_condition)
    strategy.entry("Sell", strategy.short, when=sell_condition)

// Update average entry price for buy condition
if buy_condition
    avgEntryPrice := close

// Update average entry price for sell condition
if sell_condition
    avgEntryPrice := close

// Close buy position if exit condition is met
strategy.close("Buy", when=exit_buy_condition)

// Close sell position if exit condition is met
strategy.close("Sell", when=exit_sell_condition)

// Plot 200 EMA
plot(ema, color=color.blue, linewidth=2)

// Plot buy and sell signals
plotshape(buy_condition, style=shape.triangleup, location=location.belowbar, color=color.green, size=size.small)
plotshape(sell_condition, style=shape.triangledown, location=location.abovebar, color=color.red, size=size.small)