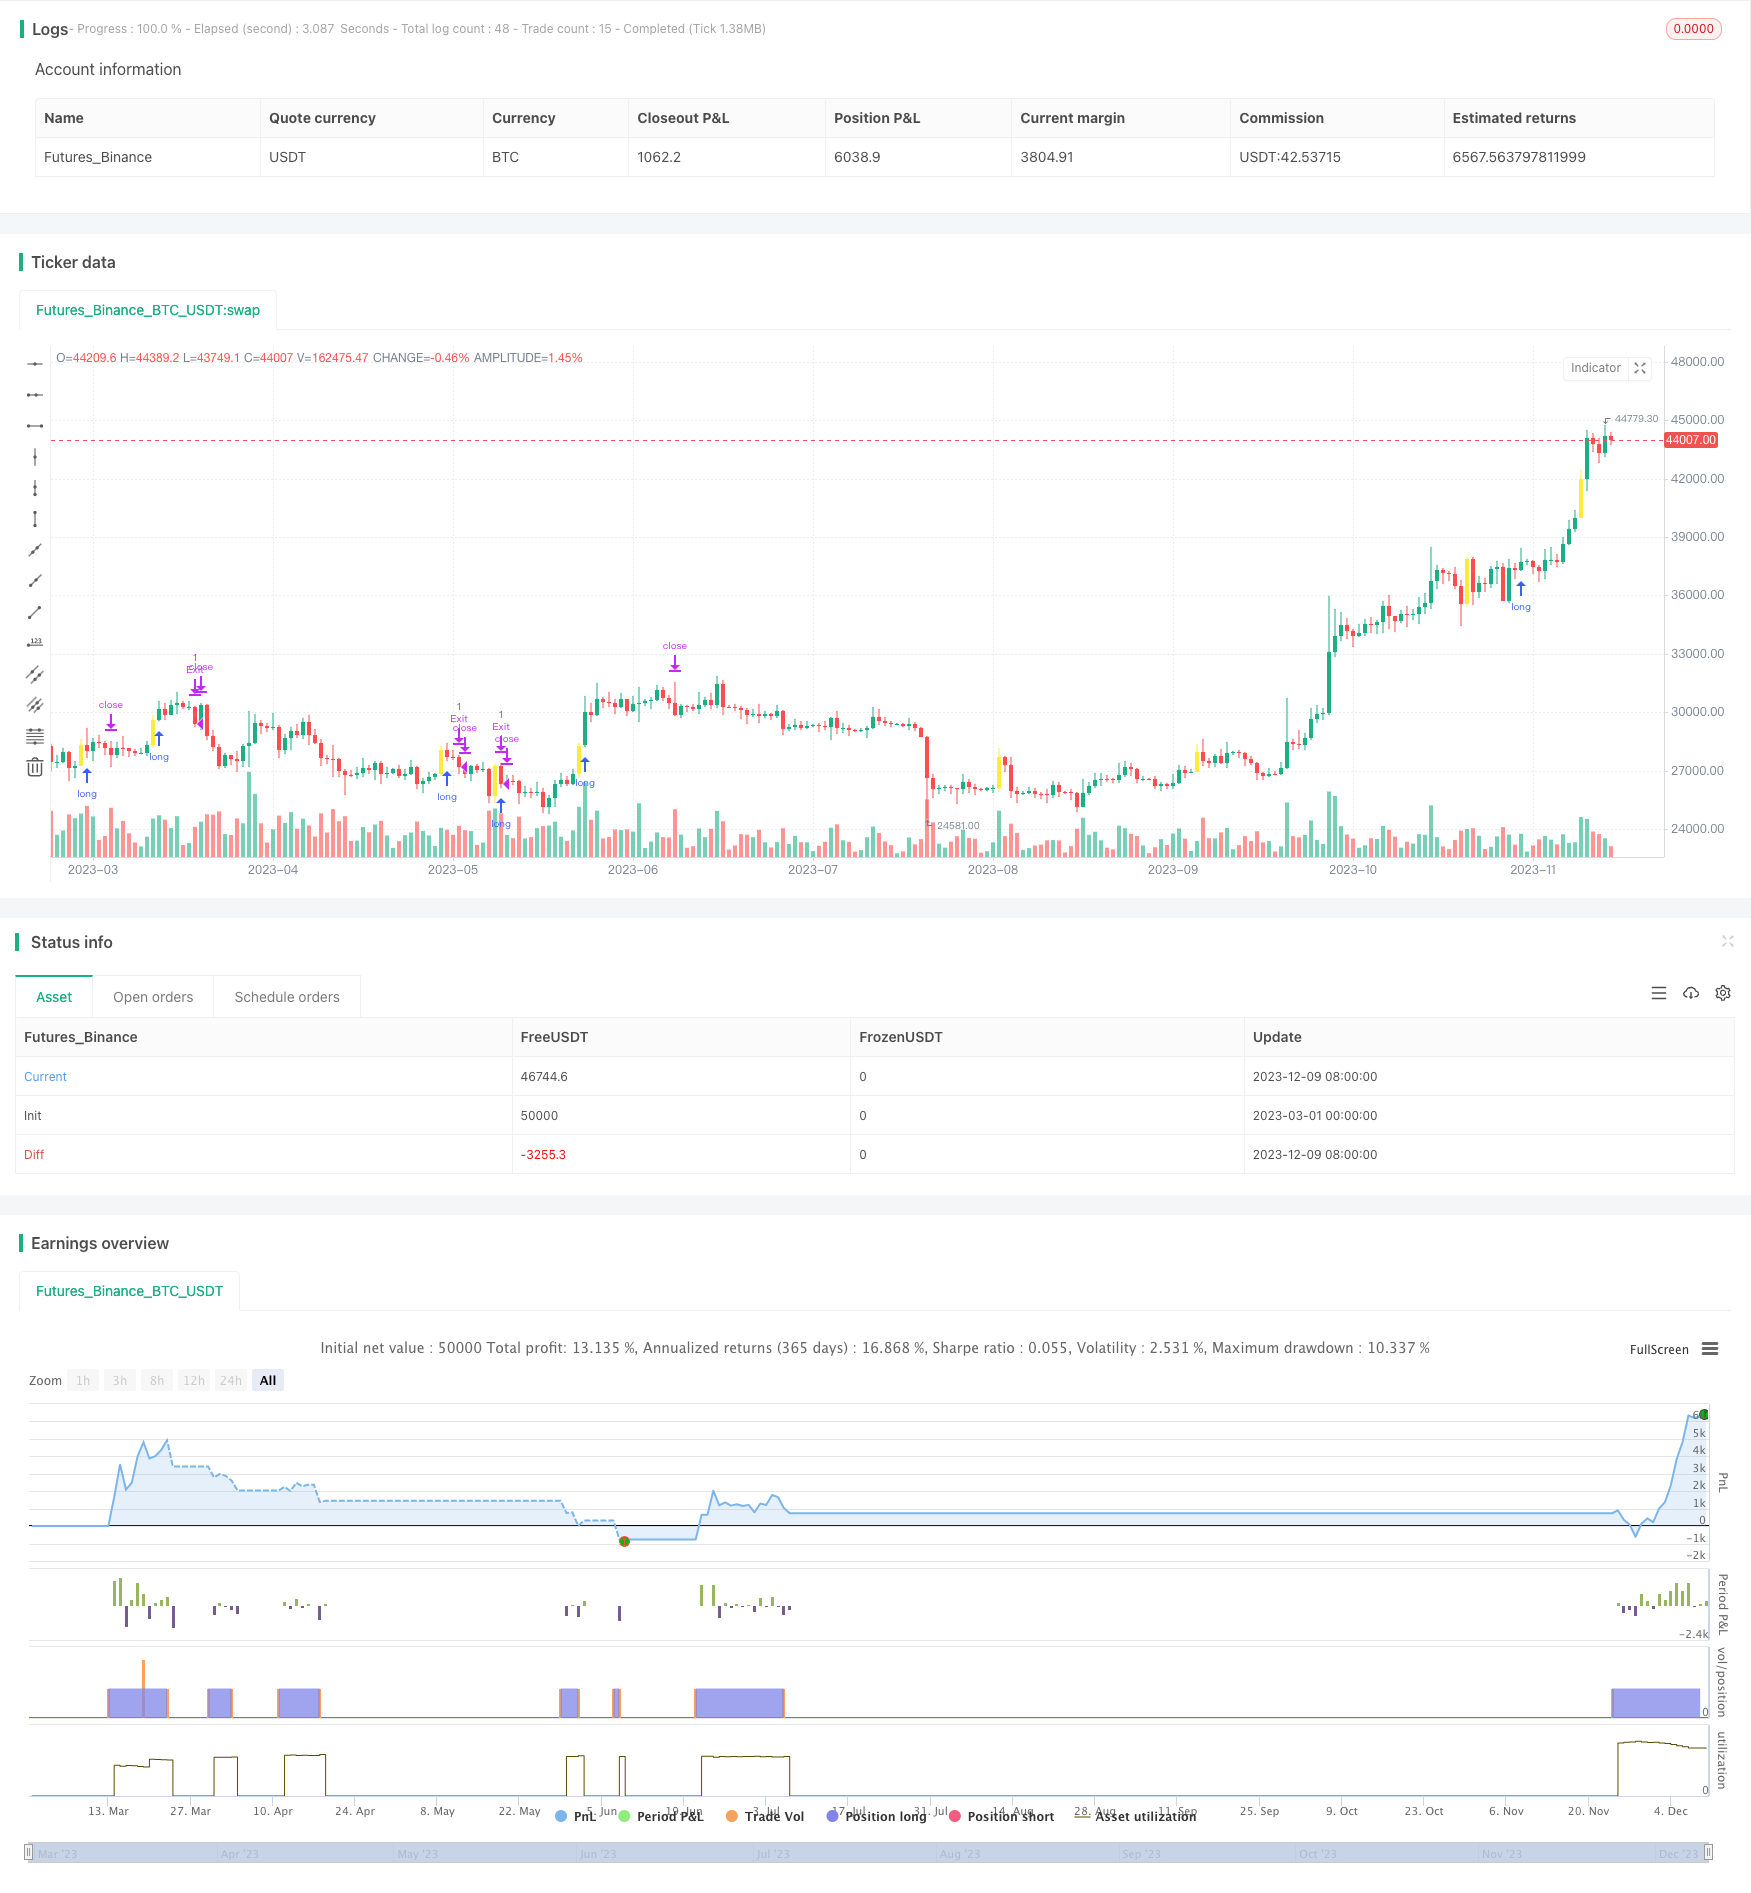
概述
动量爆发跟踪策略通过计算价格变化百分比判断价格突破,结合成交量过滤信号,实现高概率捕捉趋势的突破点。当触发买入信号后,该策略采用价格跟踪止损的方式来锁定利润,避免回撤过大。
策略原理
该策略主要通过以下几个指标判断买入时机:
价格变化百分比(isFourPercentBull) - 计算收盘价相对前一日收盘价的变化百分比,用于判断价格是否有效突破;
收盘价与最高价的比率(HighCloseRatio) - 计算收盘价与最高价的比率,判断价格突破强度;
交易量(volume) - 要求交易量大于前一日,确保有效突破;
200日简单移动平均线(SMA) - 要求收盘价和开盘价均高于200日线,判断趋势方向。
当上述多个条件同时满足时,发出买入信号。之后,该策略采用价格跟踪止损方式来主动止损和锁定利润。具体来说,跟踪止损线的计算公式为:
trailPrice = close * (100 - trailPercent) / 100
其中trailPercent为可配置的止损跟踪百分比。这 Ensure 的是,只要价格上涨,止损线也会跟着上涨,从而锁定利润。当价格回落至止损线时,平仓止损。
策略优势
这是一个典型的突破策略,具有以下优势:
- 多重条件过滤,确保突破的有效性,避免假突破;
- 采用价格跟踪止损,可以主动止损和锁定利润,最大程度避免回撤;
- 策略逻辑简单清晰,容易理解和优化。
策略风险
该策略也存在一些风险:
- 突破失败的概率仍存在,无法完全避免亏损;
- 跟踪止损过于激进可能造成频繁止损;
- 参数设置不当可能导致交易频率过高或信号漏失。
对应风险的解决方案是:
- 优化参数,降低止损幅度,确保有足够空间;
- 适当宽松突破条件,确保不会错过明确趋势;
- 测试不同品种,评估策略稳定性。
优化方向
考虑到该策略较高的止损频率,以下几个方向可以进一步优化:
- 尝试其他跟踪止损方式,如平均线跟踪、ATR 和波动率跟踪等;
- 增加机器学习算法,根据历史数据训练判断效果较好的突破参数组合;
- 增加基于交易量突破的辅助判断条件,确保突破效果;
- 评估不同品种参数设置差异,寻找最佳适配品种。
总结
动量爆发跟踪策略总体来说是一个非常实用的趋势跟踪策略。它解决了突破策略中无法有效止损和止盈的问题,在捕捉趋势的同时,又可以很好控制风险。通过参数优化和机器学习等手段的引入,该策略效果还具有进一步提升的空间,是值得深入研究和应用的。
策略源码
/*backtest
start: 2023-03-01 00:00:00
end: 2023-12-10 05:20:00
period: 1d
basePeriod: 1h
exchanges: [{"eid":"Futures_Binance","currency":"BTC_USDT"}]
*/

// This source code is subject to the terms of the Mozilla Public License 2.0 at https://mozilla.org/MPL/2.0/
// © doks23

//@version=5
strategy(title = "SD:Momentum Burst", overlay=true, initial_capital=1000,commission_value = 0,slippage = 0,process_orders_on_close=true)

//Check Vol
checkVol = input.bool(defval=false,title="IncludeAvgVolume?")
volSMAlength = input(50, title="VolumeLength")
volumeSma = ta.sma(volume, volSMAlength)
highvolume = volume >= volumeSma
volumeCond=checkVol?highvolume:true

// Profit and Loss
trailPercent    = input.float(title="Trail%", defval=3, step=0.1)

//longCondition
PercentThreshold=input.float(3.8,'BreakoutPercent', step=0.1)
MaxThreshold=input.float(10,'Max Breakout', step=0.1)
HighCloseRatio=input.float(70,'Close to High Ratio', step=1)
float candleCloseBull = ((close[0] - open[0]) / (high[0] - open[0]) * 100)
float isFourPercentBull = (((close[0] - close[1]) / close[1]) * 100)
LongCond=volume > volume[1] and isFourPercentBull > PercentThreshold and candleCloseBull > HighCloseRatio and isFourPercentBull<MaxThreshold
barcolor(color=(LongCond?color.yellow: na),title='BObar')
longCondition= LongCond and volumeCond and close>ta.sma(close,200) and open>ta.sma(close,200)

//Input Strategy
DateCheck=  input.bool(title = 'Custom Date Range?', defval=true,group = 'Strategy')
FromDate=   input(defval = timestamp("1 Jan 2019 00:00"),group = 'Strategy')
ToDate      =input(defval = timestamp("31 Dec 2023 00:00"),group = 'Strategy')
PostionSize =input.string('Contract','Select Position Size',options = ['Percent of Equity','Contract'],group = 'Strategy')
ContractQty =input.int(1,'No of Contract',group = 'Strategy')

//Backtesting Date Range
TimeWindow=true
// Number of Contract
var int trade_qty=na
if(PostionSize=='Contract')
    trade_qty:=ContractQty
else
    trade_qty:= (strategy.equity>strategy.initial_capital)?math.floor(strategy.equity/strategy.initial_capital):ContractQty


//Position Buy
BuyTriggerPrice = ta.valuewhen(longCondition,high,0)
//Trailing price
var float trailPrice    = na
float percentMulti = (100 - trailPercent) / 100
longCondition2=longCondition and TimeWindow
if longCondition2
    strategy.entry("Long", strategy.long,qty=trade_qty,stop = BuyTriggerPrice)
    trailPrice := close*percentMulti
if strategy.position_size>0
    trailPrice := math.max(close*percentMulti,trailPrice[1])
    if low <= trailPrice
        strategy.exit('Exit','Long',stop = trailPrice)
        if strategy.position_size==0
            trailPrice:=na
// Plot Strategy
var float trail_long_SL=na
if strategy.position_size>0
    trail_long_SL:=trailPrice
else
    trail_long_SL:=na
//Strategy Plot
PlotMA=input.bool(title="Plot MA?", defval=false)
plot(PlotMA?ta.sma(close,10):na,color = color.red,title = '10MA')
plot(PlotMA?ta.sma(close,21):na,color = color.white,title = '21MA')
plot(PlotMA?ta.sma(close,200):na,color = color.orange,title = '200MA')
// plot(trail_long_SL,color = color.gray,style = plot.style_steplinebr,linewidth = 1)