概述
该策略通过RSI指标与平滑RSI指标的结合,寻找价格低点买入机会。当RSI指标创新低而价格没有创新低时,认为是多头分型信号。结合平滑RSI指标的趋势判断,可以提高策略的效果。
策略原理
- 计算RSI指标,参数为14日线。
- 计算平滑RSI指标,通过双重WMA平均实现平滑效果。
- 判断RSI是否低于30,即超卖。
- 判断平滑RSI是否低于35,方向性较强。
- 判断RSI的最低点是否低于25。
- 计算RSI分型,即寻找RSI创新低而价格没有创新低的情况。
- 计算平滑RSI的下降周期,需要达到3日。
- 当上述条件都满足时,产生买入信号。
- 设置止损和止盈条件。
该策略主要依靠RSI指标反转性质,结合平滑RSI判断趋势,在价格承压而RSI超卖时买入。达到止盈或止损后平仓。
策略优势分析
- 双RSI指标组合,提高策略效果。
- 利用RSI指标的反转特征,有一定的概率优势。
- 平滑RSI判断趋势有助于避免假反转。
- 完整的止损止盈逻辑,可以限制风险。
风险分析
- RSI反转失败的概率,无法完全避免。
- 平滑RSI指标滞后,可能错过最佳买入时机。
- 止损点设置过于宽松,亏损扩大的风险。
可以通过调整RSI参数,优化买入时机。适当缩短止损间距,加快止损速度。结合其他指标判断趋势风险,降低假反转概率。
优化方向
- 可以测试不同参数下RSI指标的效果。
- 优化平滑RSI的计算方法,提高平滑质量。
- 调整止盈止损点,寻找最优风险回报比。
- 增加量能指标等判断力度,避免量能不足情况。
通过参数调整和组合更多指标,可以进一步提升策略交易效果。
总结
该策略整体是一个利用RSI反转特征的策略思路。双RSI指标组合充分发挥RSI反转效果的同时,也增加了指标分歧带来的不确定性。整体是一个典型的指标策略思路。通过不断测试优化可以提高指标参数的适用性,也可以组合更多指标判断来降低误判概率,增强策略健壮性。
策略源码
/*backtest
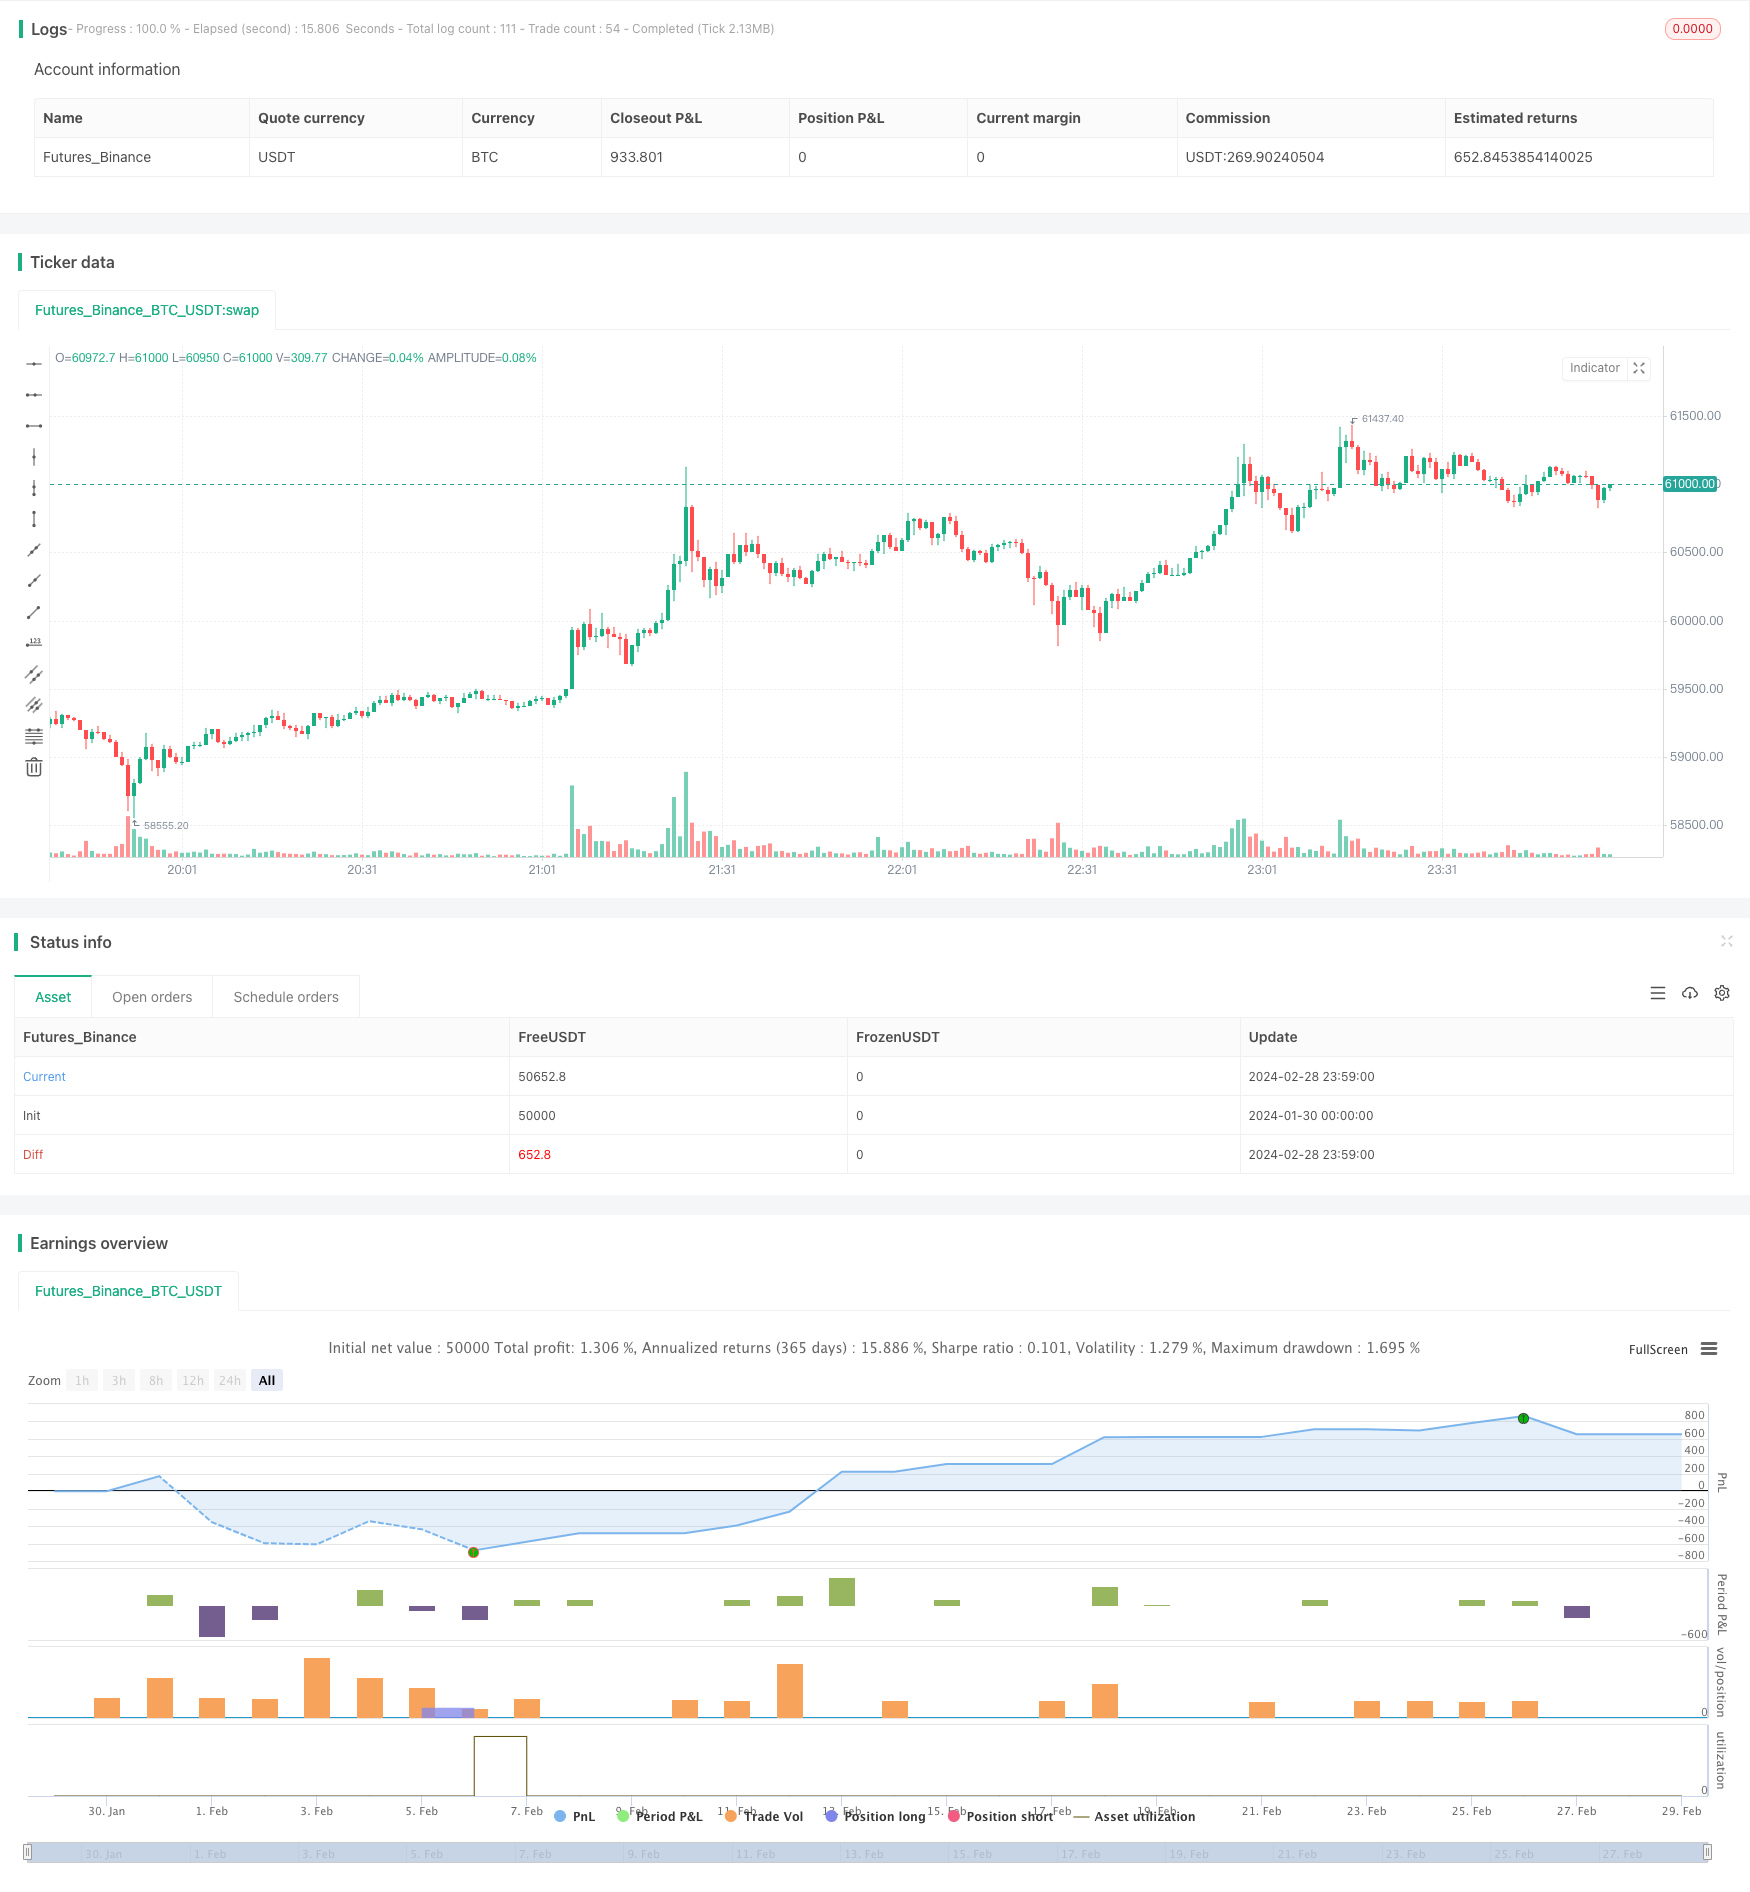
start: 2024-01-30 00:00:00
end: 2024-02-29 00:00:00
period: 1m
basePeriod: 1m
exchanges: [{"eid":"Futures_Binance","currency":"BTC_USDT"}]
*/
// This source code is subject to the terms of the Mozilla Public License 2.0 at https://mozilla.org/MPL/2.0/
// © BigBitsIO
//@version=4
strategy(title="RSI and Smoothed RSI Bull Div Strategy [BigBitsIO]", shorttitle="RSI and Smoothed RSI Bull Div Strategy [BigBitsIO]", overlay=true, pyramiding=1, default_qty_type=strategy.percent_of_equity, default_qty_value=100, commission_type=strategy.commission.percent, commission_value=.1, slippage=0)
TakeProfitPercent = input(3, title="Take Profit %", type=input.float, step=.25)
StopLossPercent = input(1.75, title="Stop Loss %", type=input.float, step=.25)
RSICurve = input(14, title="RSI Lookback Period", type=input.integer, step=1)
BuyBelowTargetPercent = input(0, title="Buy Below Lowest Low In RSI Divergence Lookback Target %", type=input.float, step=.05)
BuyBelowTargetSource = input(close, title="Source of Buy Below Target Price", type=input.source)
SRSICurve = input(10, title="Smoothed RSI Lookback Period", type=input.integer, step=1)
RSICurrentlyBelow = input(30, title="RSI Currently Below", type=input.integer, step=1)
RSIDivergenceLookback = input(25, title="RSI Divergence Lookback Period", type=input.integer, step=1)
RSILowestInDivergenceLookbackCurrentlyBelow = input(25, title="RSI Lowest In Divergence Lookback Currently Below", type=input.integer, step=1)
RSISellAbove = input(65, title="RSI Sell Above", type=input.integer, step=1)
MinimumSRSIDownTrend = input(3, title="Minimum SRSI Downtrend Length", type=input.integer, step=1)
SRSICurrentlyBelow = input(35, title="Smoothed RSI Currently Below", type=input.integer, step=1)
PlotTarget = input(false, title="Plot Target")
RSI = rsi(close, RSICurve)
SRSI = wma(2*wma(RSI, SRSICurve/2)-wma(RSI, SRSICurve), round(sqrt(SRSICurve))) // Hull moving average
SRSITrendDownLength = 0
if (SRSI < SRSI[1])
SRSITrendDownLength := SRSITrendDownLength[1] + 1
// Strategy Specific
ProfitTarget = (close * (TakeProfitPercent / 100)) / syminfo.mintick
LossTarget = (close * (StopLossPercent / 100)) / syminfo.mintick
BuyBelowTarget = BuyBelowTargetSource[(lowestbars(RSI, RSIDivergenceLookback)*-1)] - (BuyBelowTargetSource[(lowestbars(RSI, RSIDivergenceLookback)*-1)] * (BuyBelowTargetPercent / 100))
plot(PlotTarget ? BuyBelowTarget : na)
bool IsABuy = RSI < RSICurrentlyBelow and SRSI < SRSICurrentlyBelow and lowest(SRSI, RSIDivergenceLookback) < RSILowestInDivergenceLookbackCurrentlyBelow and BuyBelowTargetSource < BuyBelowTarget and SRSITrendDownLength >= MinimumSRSIDownTrend and RSI > lowest(RSI, RSIDivergenceLookback)
bool IsASell = RSI > RSISellAbove
if IsABuy
strategy.entry("Positive Trend", true) // buy by market
strategy.exit("Take Profit or Stop Loss", "Positive Trend", profit = ProfitTarget, loss = LossTarget)
if IsASell
strategy.close("Positive Trend")