概述
本策略通过结合移动平均线指标、相对强弱指标(RSI)和吞噬形态,在黄金交易中进行长短双向操作。其中使用21日线、50日线和200日线的交叉作为主要的交易信号,RSI指标和吞噬形态辅助过滤信号,进一步优化入市点位。
策略原理
该策略主要通过以下几个方面进行交易决策:
- 移动平均线交叉
使用21日线和200日线的金叉/死叉作为判断趋势转折的主要指标。当21日线上穿200日线时为看涨信号,当21日线下穿200日线时为看跌信号。此外结合50日线过滤跳空信号。
- RSI指标辅助
设置RSI指标的超买线和超卖线,当RSI高于70为超买,当RSI低于30为超卖。在看涨信号时RSI需处于非超买区域,在看跌信号时RSI需处于非超卖区域,避免买入高点卖出低点。
- 吞噬形态确认
看涨信号发出时需出现看涨吞噬形态candle,看跌信号发出时需出现看跌吞噬形态candle,以确认趋势转折。
当以上三个条件同时满足时产生交易信号并下单,于是形成了一套比较严格的 Filters。
策略优势
该策略最大的优势在于利用了多种参数和指标进行综合判断,较好地过滤了错误信号,可以减少不必要的止损。具体优势体现在以下几个方面:
移动平均线策略本身具有一定的稳定性。
RSI指标的设置避免了买入高点和卖出低点。
吞噬形态的加入,可以进一步确认趋势反转的可靠性。
止损幅度较小,可以有效控制风险。
策略风险
虽然该策略在信号过滤和风险控制方面做的不错,但任何策略都会存在一定的弱点和风险。
参数设置较为复杂,可能需要大量测试找到最佳参数组合。
入场信号较为严格,可能会错过部分好的机会。
在剧烈行情中,会出现一定程度的滞后。
长期运行是否稳定还有待验证。
针对以上风险,我们可以通过调整参数、优化代码逻辑、结合其他指标等方式进行改进和优化。
优化方向
该策略在多种指标的综合判断上做的不错,但仍有优化的空间。主要的优化方向包括:
调整参数寻找最佳组合。可以通过更多历史数据的回测,对比不同参数对结果的影响,找到一组更优的参数设定。
结合其他指标进行辅助。例如MACD,KD等指标也可以辅助判断趋势转折的时机。适当引入其他指标可以形成更强大的指标体系。
优化和完善止损机制。现有的止损幅度较小,可以进一步测试不同幅度的止损是否可以减少不必要的头寸切换。
测试更长时间段的数据,验证策略的长期有效性。通过更多年限和市场行情的回测,检验策略的稳定性。
总结
本策略综合运用了移动平均线、RSI指标和吞噬形态等多种技术分析工具,在黄金交易中进行长短双向操作。通过参数设定和信号过滤形成了一套较为严格的策略体系,在一定程度上控制了风险。但任何策略都不可能百分之百完美,本策略也仍有许多优化的空间和方向。总的来说,该策略为量化交易提供了一定参考,但仍需谨慎对待,根据实际情况进行调整。
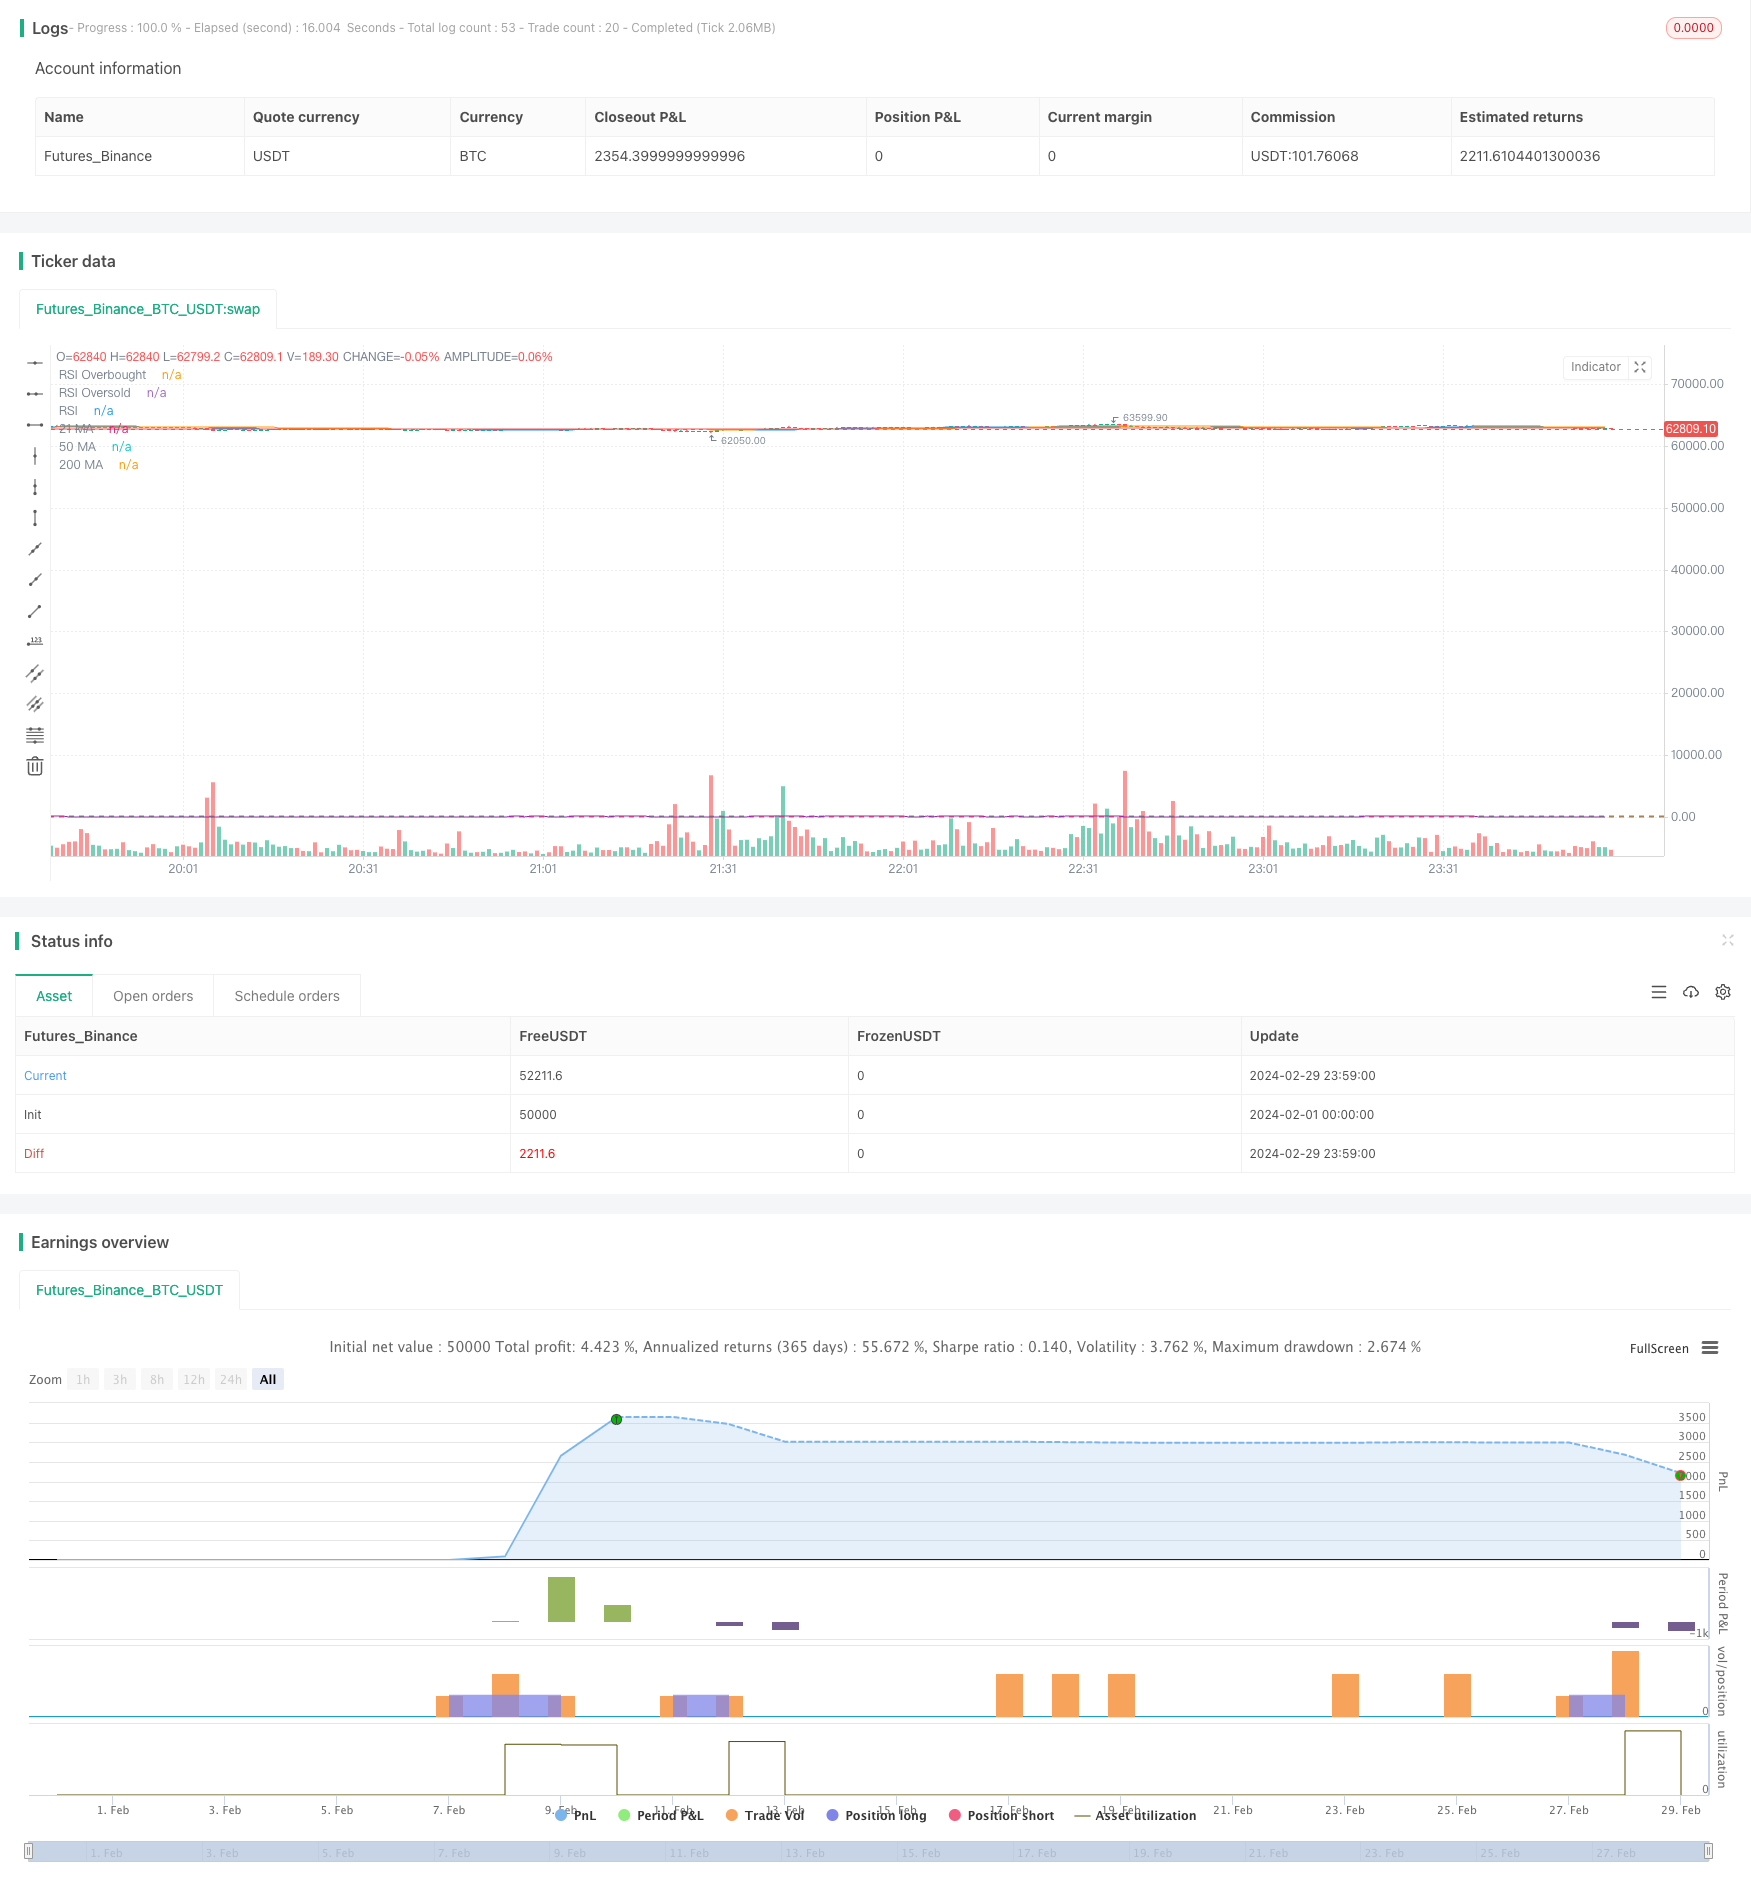
/*backtest
start: 2024-02-01 00:00:00
end: 2024-02-29 23:59:59
period: 1m
basePeriod: 1m
exchanges: [{"eid":"Futures_Binance","currency":"BTC_USDT"}]
*/

//@version=4
strategy("Gold Trading with Simons Strategy", overlay=true)

// Parameters
length21 = input(21, minval=1, title="Length for 21 MA")
length50 = input(50, minval=1, title="Length for 50 MA")
length200 = input(200, minval=1, title="Length for 200 MA")
rsiLength = input(14, minval=1, title="RSI Length")
rsiOverbought = input(70, title="RSI Overbought Level")
rsiOversold = input(30, title="RSI Oversold Level")
takeProfitPercent = input(4, title="Take Profit %")
stopLossPercent = input(1, title="Stop Loss %")

// Moving Averages
ma21 = sma(close, length21)
ma50 = sma(close, length50)
ma200 = sma(close, length200)

// RSI
rsi = rsi(close, rsiLength)

// Engulfing Pattern
isBullishCandle(c) => close[c] > open[c]
isBearishCandle(c) => close[c] < open[c]

bearishEngulfing = isBullishCandle(1) and isBearishCandle(0) and close < open[1] and open > close[1]
bullishEngulfing = isBearishCandle(1) and isBullishCandle(0) and close > open[1] and open < close[1]

// Calculate Take Profit and Stop Loss Levels
takeProfitLevel(entryPrice) => entryPrice * (1 + takeProfitPercent / 100)
stopLossLevel(entryPrice) => entryPrice * (1 - stopLossPercent / 100)

// Entry Conditions
longCondition = crossover(ma21, ma200) and close > ma21 and close > ma50 and rsi < rsiOverbought and bullishEngulfing
shortCondition = crossunder(ma21, ma200) and close < ma21 and close < ma50 and rsi > rsiOversold and bearishEngulfing

// Entry
if (longCondition)
    entryPrice = close
    strategy.entry("Long", strategy.long)
    strategy.exit("Take Profit", "Long", limit=takeProfitLevel(entryPrice))
    strategy.exit("Stop Loss", "Long", stop=stopLossLevel(entryPrice))
if (shortCondition)
    entryPrice = close
    strategy.entry("Short", strategy.short)
    strategy.exit("Take Profit", "Short", limit=takeProfitLevel(entryPrice))
    strategy.exit("Stop Loss", "Short", stop=stopLossLevel(entryPrice))

// Plotting
plot(ma21, color=color.blue, title="21 MA")
plot(ma50, color=color.orange, title="50 MA")
plot(ma200, color=color.red, title="200 MA")
hline(rsiOverbought, "RSI Overbought", color=color.green)
hline(rsiOversold, "RSI Oversold", color=color.red)
plot(rsi, "RSI", color=color.purple)