概述
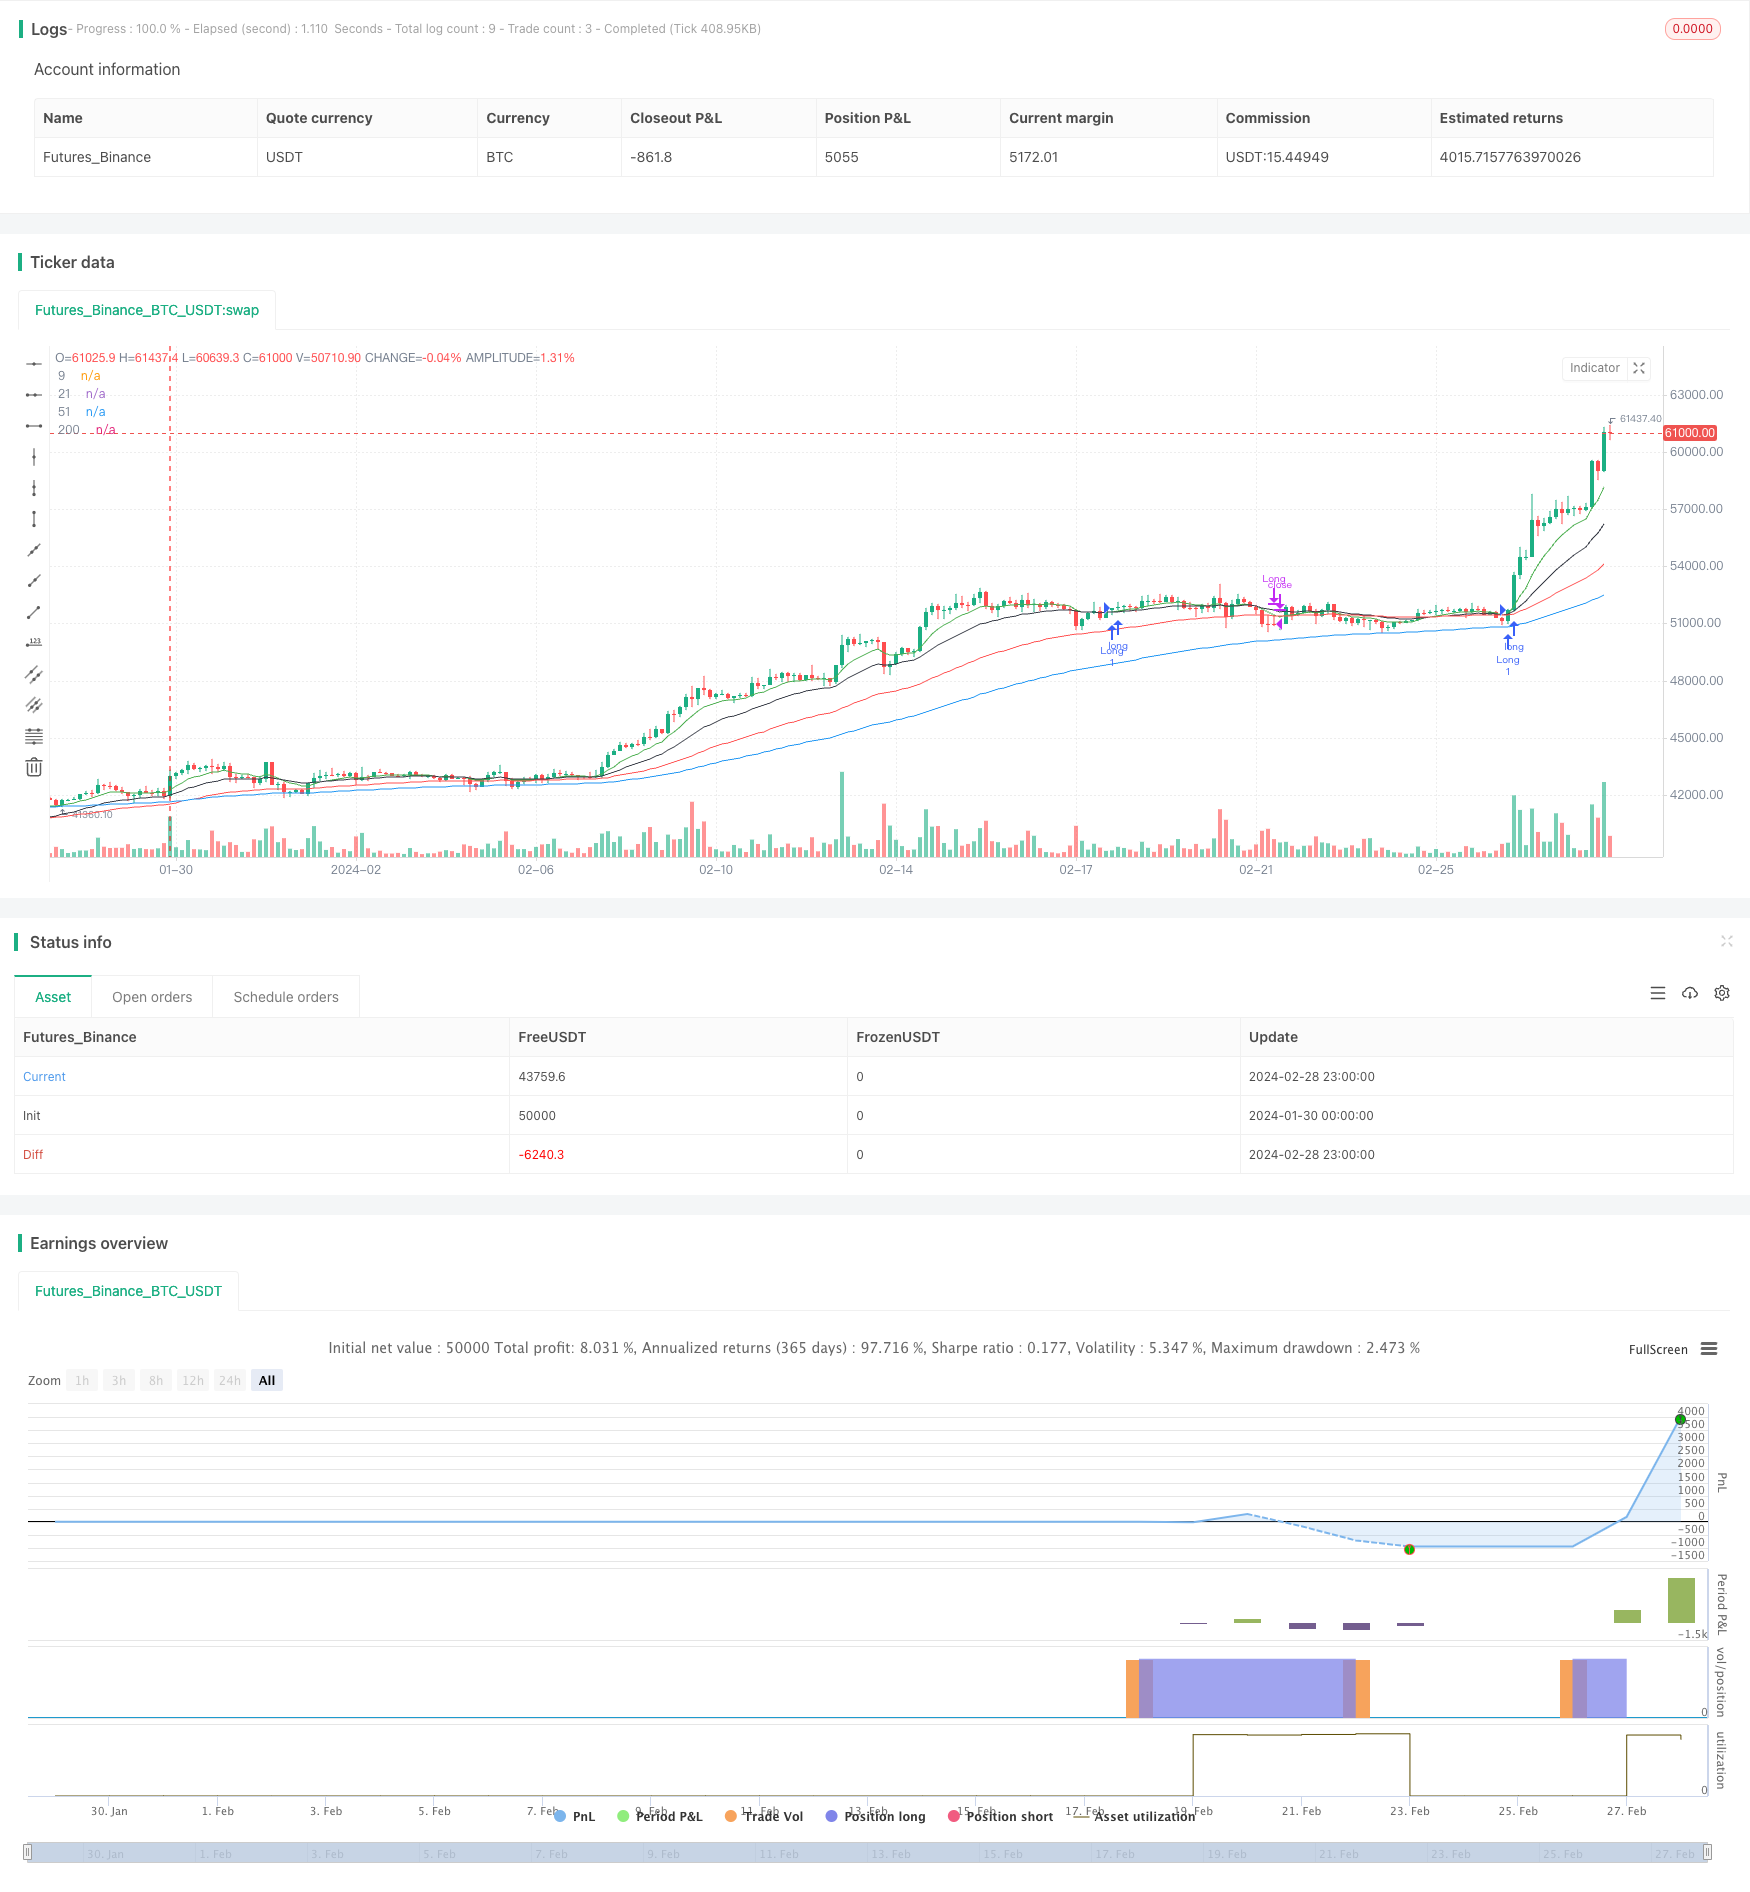
本文主要分析了Ravikant_sharma开发的基于多重指数移动平均线(EMA)和相对强弱指数(RSI)的量化交易策略。该策略通过EMA不同周期的交叉以及RSI的数值判定,识别价格趋势,确定入场和出场时机。
策略原理
指标计算
策略使用5条不同周期的EMA,包括9日线、21日线、51日线、100日线和200日线。代码中仅绘制了前4条EMA。RSI参数设置为14。
入场条件
满足以下任一条件时,策略做多开仓:
- 9日EMA上穿21日EMA
- 9日EMA上穿51日EMA
- 51日EMA下穿100日EMA
同时需要RSI大于65,表示强势上涨趋势。
出场条件
满足以下任一条件时,策略平仓退出:
- 9日EMA下穿51日EMA,表明趋势反转
- 收盘价格超过入场价格的125%,达到盈利目标
- RSI数值低于40,表明出现反转信号
- 收盘价格低于入场价格的98%,止损
优势分析
这是一个典型的趋势追踪策略,具有以下优势:
- 使用EMA交叉判断趋势方向,可有效跟踪价格趋势
- 结合不同周期的EMA,可以识别更加可靠的趋势信号
- RSI过滤器可避免在震荡行情中产生错误信号
- 设定止盈止损位置,可以锁定盈利,控制风险
风险及解决方法分析
该策略也存在一些风险:
- 在震荡行情中可能出现多次不確定信号,导致过于频繁交易。可以适当调整EMA周期参数,或增加RSI过滤条件。
- 行情剧烈反转时,EMA交叉信号可能滞后,无法及时止损。可以结合其他指标判断做多与做空信号强度。
- 盈利目标和止损幅度設置不当,可能出现早止损或未及时止盈。应根据不同品种特性和市场环境优化参数。
策略优化方向
该策略还可以从以下几个方向进行优化:
- 增加交易品种的参数优化,针对不同品种设定最佳参数组合
- 增加其他指标判断,如KDJ、MACD等,形成多因子模型
- 增加机器学习风控手段,利用模型判断信号质量,降低误判概率
- 结合情绪面分析,避免被极端情绪驱动产生错误交易
- 测试不同的止盈止损策略,寻找最优参数
总结
本策略整体上是一个可靠、易于实施的趋势追踪策略。它使用EMA多周期交叉判定趋势方向,再结合RSI过滤假信号,在回测效果较好的基础上进行参数优化和模型优化,可望获得稳定收益。但交易者在使用时,仍需警惕行情反转和参数不当带来的风险。
策略源码
/*backtest
start: 2024-01-30 00:00:00
end: 2024-02-29 00:00:00
period: 3h
basePeriod: 15m
exchanges: [{"eid":"Futures_Binance","currency":"BTC_USDT"}]
*/

// This source code is subject to the terms of the Mozilla Public License 2.0 at https://mozilla.org/MPL/2.0/
// © Ravikant_sharma

//@version=5

strategy('new', overlay=true)

start = timestamp(1990, 1, 1, 0, 0)
end = timestamp(2043, 12, 12, 23, 59)
ema0 = ta.ema(close, 9)
ema1 = ta.ema(close, 21)
ema2 = ta.ema(close, 51)
ema3 = ta.ema(close, 100)
ema4 = ta.ema(close, 200)

rsi2=ta.rsi(ta.sma(close,14),14)
plot(ema0, '9', color.new(color.green, 0))
plot(ema1, '21', color.new(color.black, 0))
plot(ema2, '51', color.new(color.red, 0))
plot(ema3, '200', color.new(color.blue, 0))

//plot(ema4, '100', color.new(color.gray, 0))


//LongEntry = (  ta.crossover(ema0,ema3)  or  ta.crossover(ema0,ema2) or  ta.crossunder(ema2,ema3) ) // ta.crossover(ema0,ema1) //
LongEntry=false
if ta.crossover(ema0,ema1)
    if rsi2>65
        LongEntry:=true
if ta.crossover(ema1,ema2)
    if rsi2>65
        LongEntry:=true

LongExit =  ta.crossunder(ema0,ema2) or close >(strategy.position_avg_price*1.25) or rsi2 <40 or close < (strategy.position_avg_price*0.98)


if time >= start and time <= end
    if(LongEntry and rsi2>60)
        strategy.entry('Long', strategy.long, 1)
    if(LongExit)
        strategy.close('Long')