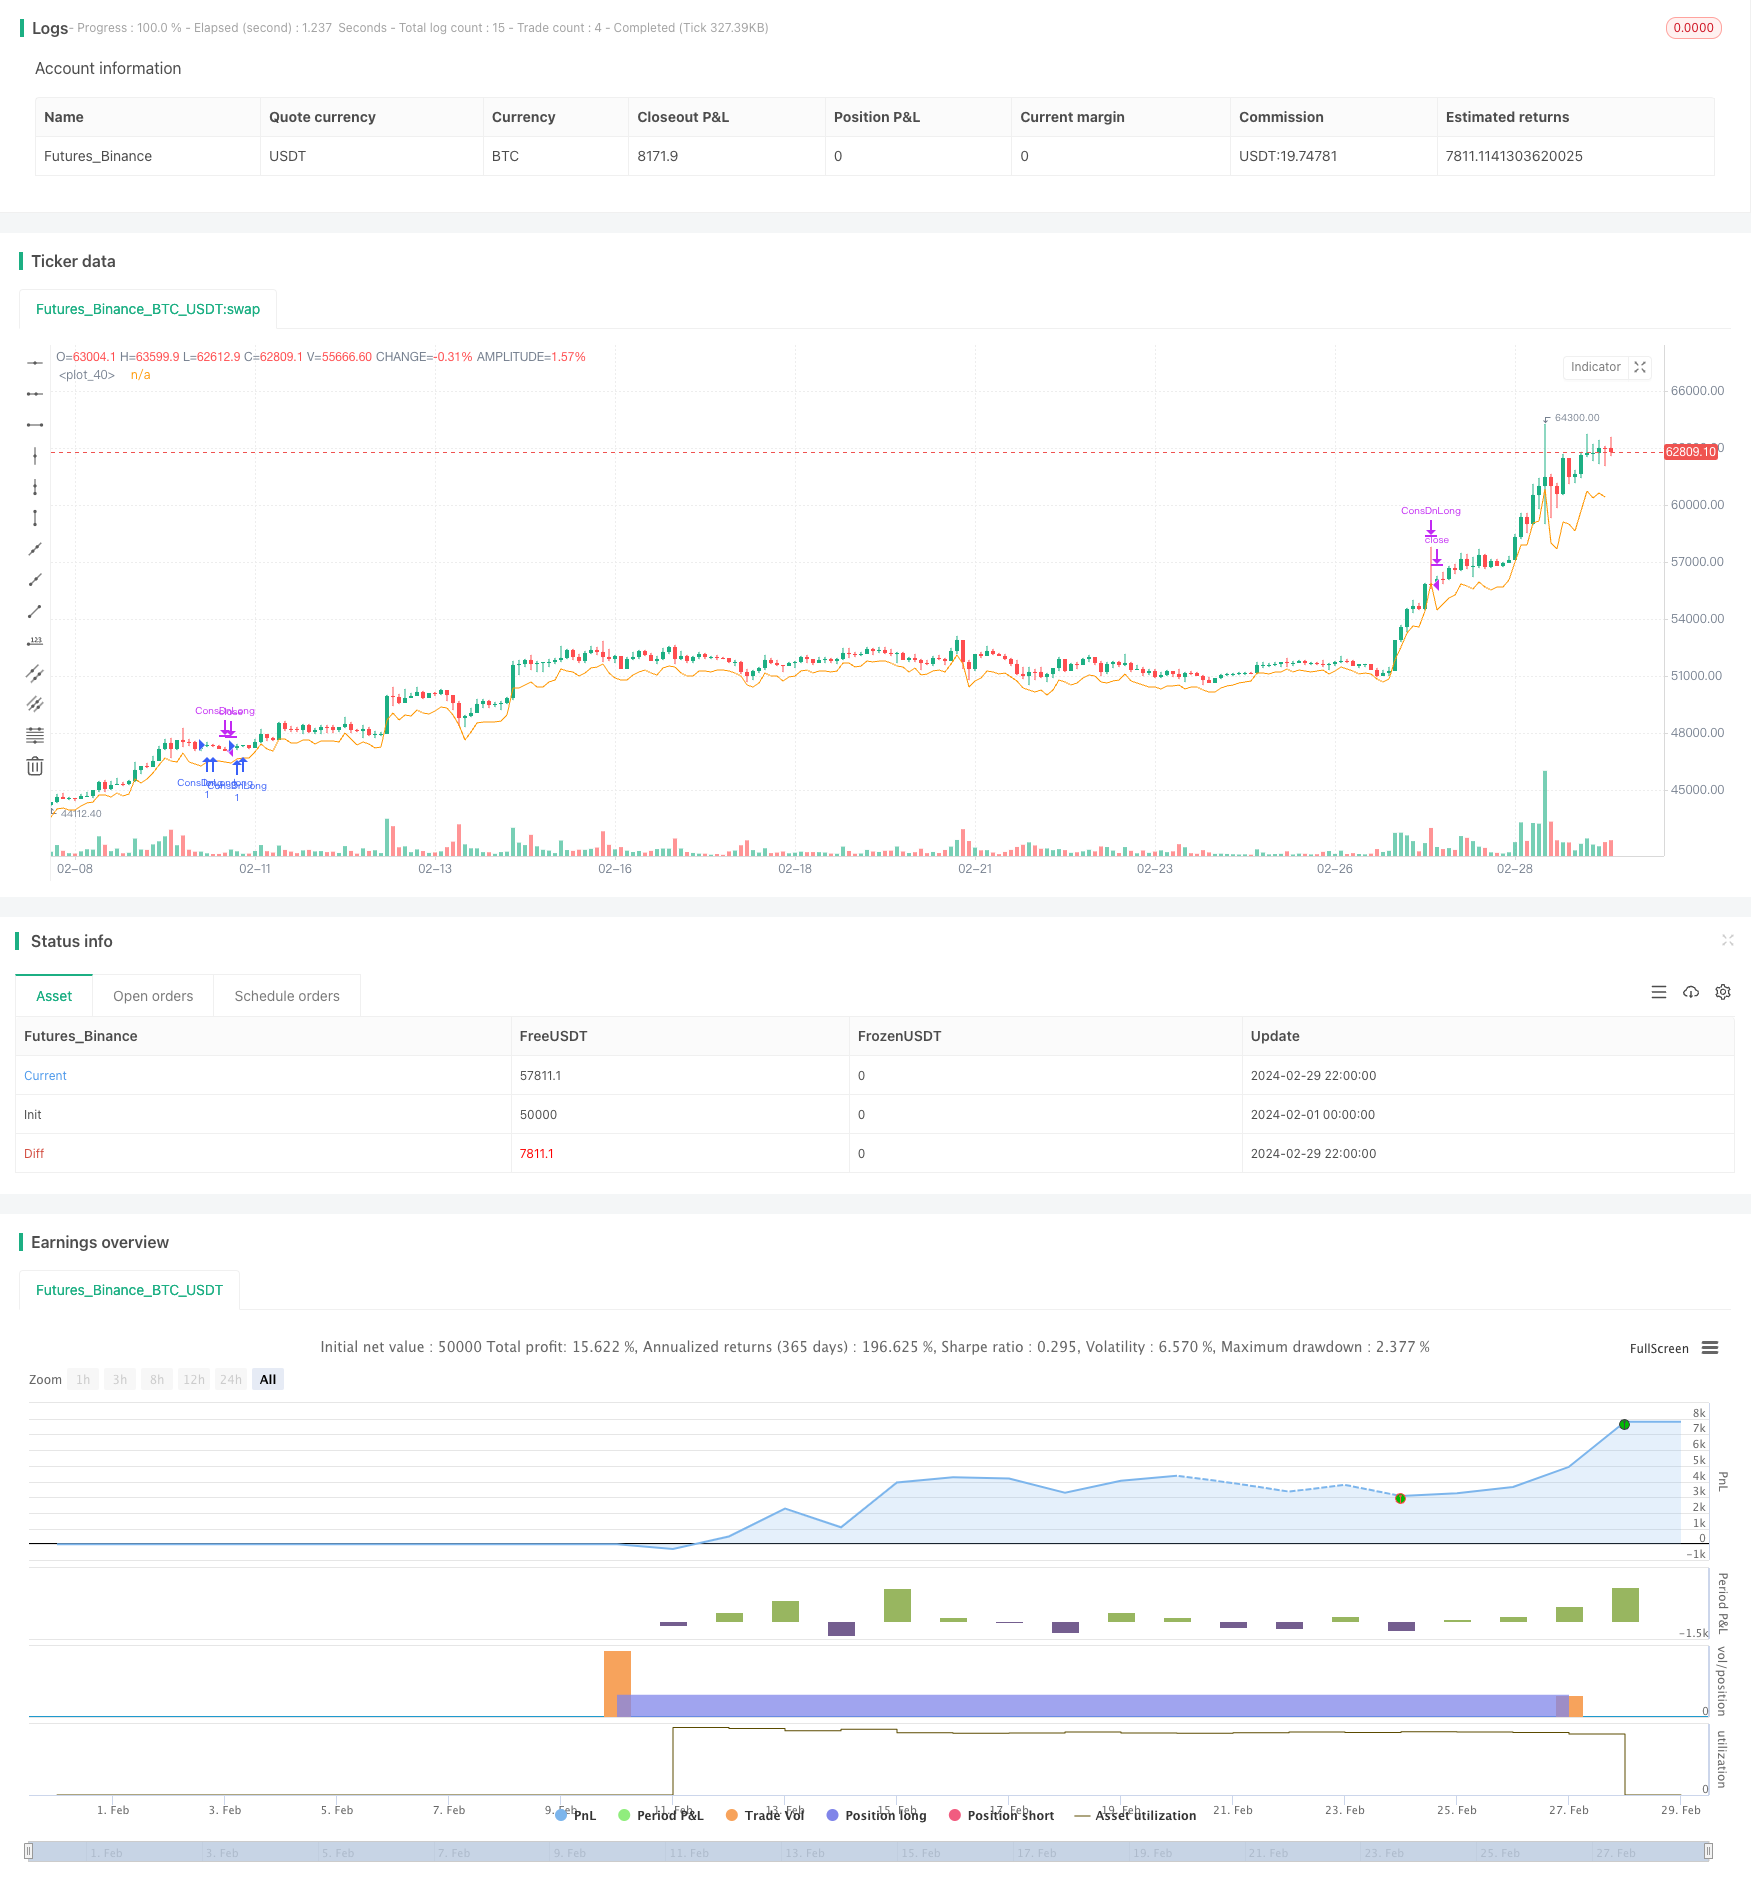
策略概述
连续K线反转突破策略的核心思想是捕捉股价在经过一段时间的连续下跌后出现反转信号并突破重要阻力位的交易机会。该策略通过设置连续下跌K线数量、连续上涨K线数量以及止损条件等参数,在特定条件满足时开仓做多,并在止损条件触发时平仓。
策略原理
- 设定进场条件:当股价连续下跌X根K线后,紧接着连续上涨Y根K线,且此时策略没有持仓,则触发进场条件,开仓做多。
- 设定止损条件:开仓后,如果股价低于前几根K线的最低收盘价,或者低于开仓时的最高价减去2倍ATR(平均真实波幅),则触发止损条件,平仓。
- 每次开仓都记录相应的进场价格和止损价格,并在平仓后重置参数,为下一次交易做准备。
- 使用pine script编写策略代码,可以在TradingView等平台上进行回测和优化。
策略的关键在于正确识别反转信号和设置合适的参数。连续下跌多少根K线以及连续上涨多少根K线是两个重要的参数,需要根据回测结果进行优化。此外,止损条件的设置也很关键,既要控制风险,又不能过早止损导致错失机会。
策略优势
- 适用于震荡市和趋势初期:该策略在股价经过一段时间调整后出现反转信号时开仓,更容易捕捉到趋势起始阶段的机会。
- 及时止损控制风险:通过设置基于前期低点和ATR的止损条件,可以在股价再次下跌时及时平仓,控制损失。
- 参数可调,适应性强:连续K线数量、止损条件等参数都可以根据市场特点和个人偏好进行调整,增强策略的适应性。
策略风险
- 参数选择不当导致频繁交易:如果连续K线数量设置过小,可能会导致策略频繁开仓平仓,增加交易成本。
- 止损位置设置不当导致损失加大:如果止损位置设置过宽,可能会导致单次交易损失过大;如果止损位置设置过窄,可能会导致本可获利的交易被过早止损。
- 对于长期趋势性行情,策略表现一般:该策略更适合在震荡市和趋势初期使用,对于长期稳定的趋势行情,可能无法充分享受到行情上涨。
- 缺乏头寸管理和资金管理:目前的策略代码中没有体现头寸管理和资金管理的内容,在实际应用中还需要加入这些内容以提升策略稳定性。
策略优化方向
- 优化连续K线数量:通过对不同参数组合进行回测,找出在最近一段时期内表现最佳的连续下跌K线数量和连续上涨K线数量。
- 优化止损条件:可以考虑使用更加动态的止损条件,例如根据ATR或者百分比来设置止损位置,以适应不同的市场波动情况。
- 加入多空双向交易:目前策略只有做多一个方向,可以考虑加入做空策略,同时捕捉上涨和下跌的机会。
- 引入头寸管理和资金管理:根据账户资金状况和风险偏好,动态调整每次交易的头寸大小,并设置总体风险限额,提高策略的稳健性。
- 结合其他技术指标或信号:可以将该策略与其他技术指标(如RSI、MACD等)或交易信号(如突破、形态等)结合,提高开仓和平仓的精确度。
策略总结
连续K线反转突破策略通过捕捉股价连续下跌后的反转信号来进行交易决策。该策略简单易懂,适合在震荡市和趋势初期使用,通过设置连续K线数量和止损条件等参数,可以灵活适应不同的市场状况。但是,该策略也存在一些局限性,如对长期趋势行情的适应性一般,缺乏头寸管理和资金管理等。
在实际应用中,需要根据市场特点和自己的风险偏好,对策略进行优化和改进。例如,优化连续K线数量和止损条件的设置,加入多空双向交易,引入头寸管理和资金管理,以及与其他技术指标和交易信号相结合等。这样可以在提高策略盈利能力的同时,控制风险,实现稳定的投资回报。
总的来说,连续K线反转突破策略是一个简单实用的交易策略,值得在实践中进一步探索和优化。但是,任何策略都不是万能的,投资者还需要结合自己的经验和判断,审慎决策,严格执行,才能在市场中长期立于不败之地。
策略源码
/*backtest
start: 2024-02-01 00:00:00
end: 2024-02-29 23:59:59
period: 2h
basePeriod: 15m
exchanges: [{"eid":"Futures_Binance","currency":"BTC_USDT"}]
*/

//@version=5
strategy("Bottom Out Strategy", overlay=true)
consecutiveBarsUp = input(2)
consecutiveBarsDown = input(3)
price = close
ups = 0.0
ups := price > price[1] ? nz(ups[1]) + 1 : 0
dns = 0.0
dns := price < price[1] ? nz(dns[1]) + 1 : 0
var entry_bar_index = 1000000
var active = false
var stop_loss = 0.0

// === INPUT BACKTEST RANGE ===
i_from = input(defval = timestamp("01 Jan 2023 00:00 +0000"), title = "From")
i_thru = input(defval = timestamp("01 Mar 2024 00:00 +0000"), title = "Thru")
// === FUNCTION EXAMPLE ===
date() => true

entry_condition() =>
	date() and dns[2] >= consecutiveBarsDown and ups >= consecutiveBarsUp and not active

exit_condition() =>
	date() and active and (close < nz(stop_loss) or close < high - 2 * ta.atr(7))

if (entry_condition())
	strategy.entry("ConsDnLong", strategy.long, comment="CDLEntry")
	entry_bar_index := bar_index
	active := true
	stop_loss := math.min(close, close[1], close[2])
	// log.info("Entry at bar {0}, close={1}, stop_loss={2} ", entry_bar_index, close, stop_loss)
if (exit_condition())
	strategy.close("ConsDnLong", comment = "CDLClose")
	// log.info("Close at bar {0}", bar_index)
	entry_bar_index := 1000000
	active := false
// if (dns >= consecutiveBarsDown)
// 	strategy.entry("ConsDnSE", strategy.short, comment="ConsDnSE")
//plot(strategy.equity, title="equity", color=color.red, linewidth=2, style=plot.style_areabr)
plot(high - 2* ta.atr(7))