Trend Momentum Strategy Based on 21 EMA, Volume, and RSI

Strategy Overview
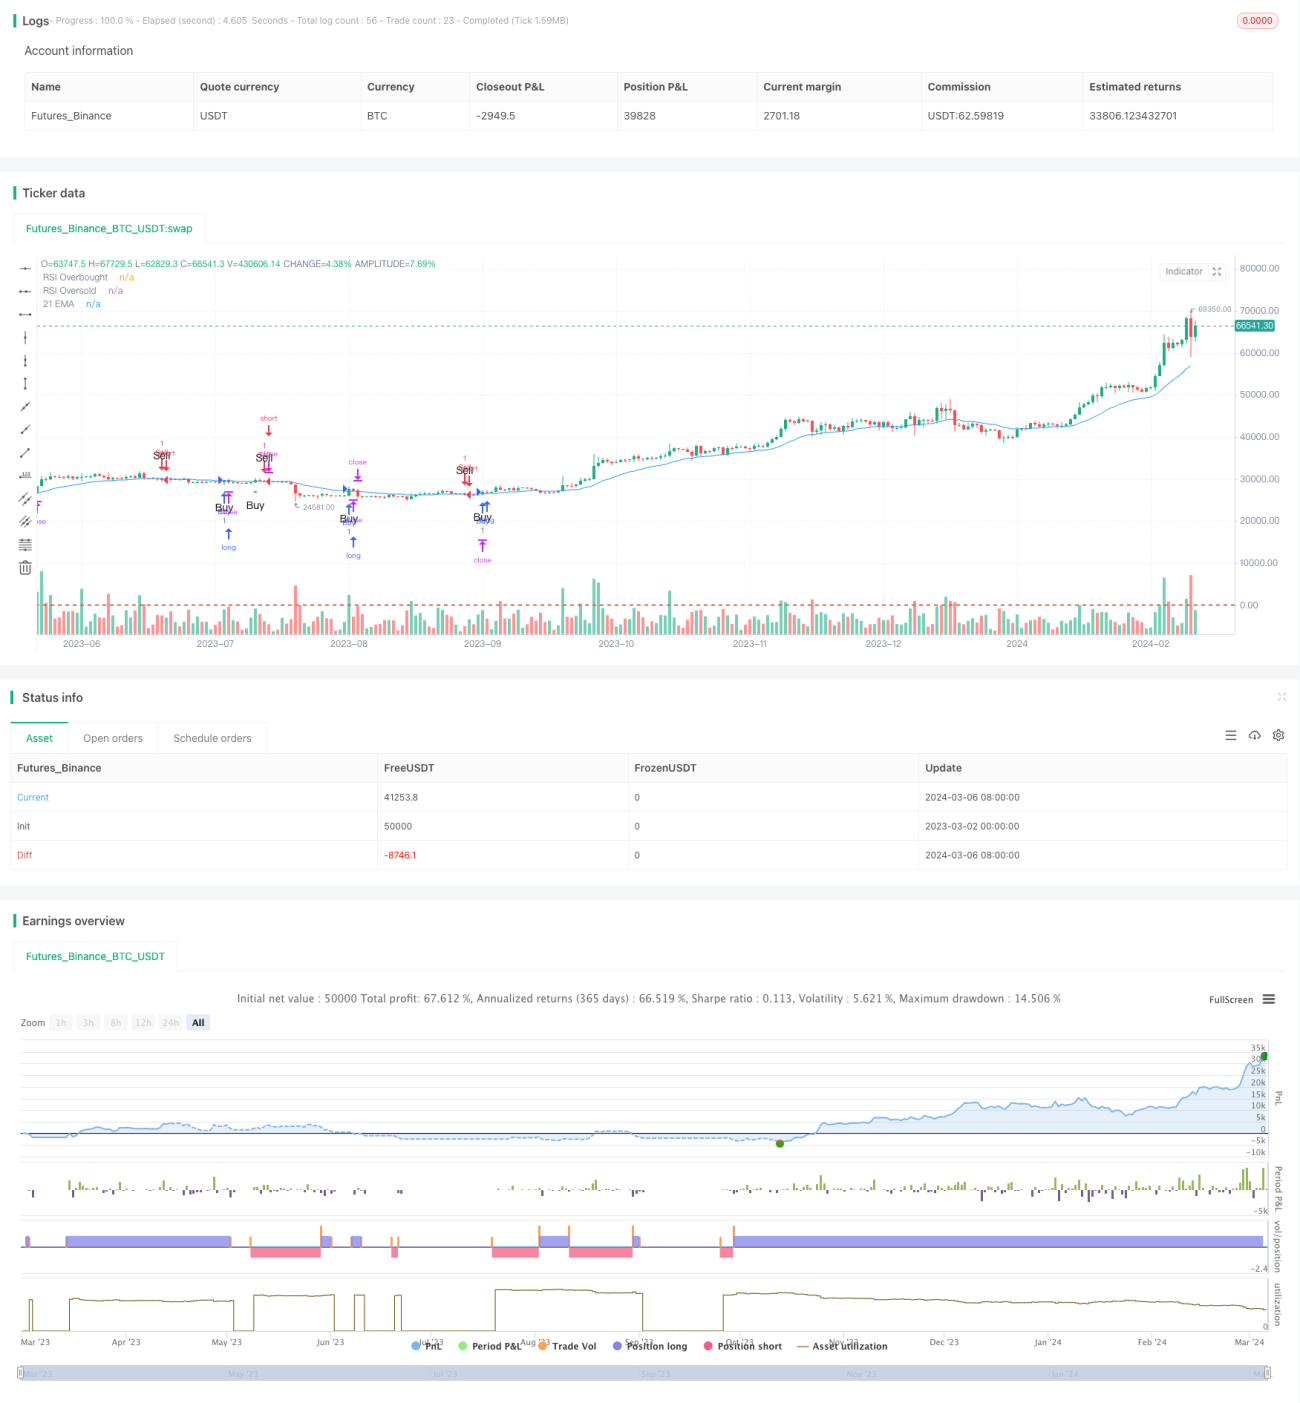
This strategy is an advanced version of the classic 21-day Exponential Moving Average (21 EMA) trading approach, incorporating volume analysis and the Relative Strength Index (RSI) to provide more reliable buy and sell signals. The strategy aims to leverage trend momentum and identify high-probability entry points in both bullish and bearish markets using additional confirmation layers.
Strategy Principles
The core of this strategy is the 21-day EMA. When the price crosses above the EMA, it generates a potential buy signal, and when it crosses below, it generates a potential sell signal, indicating a trend reversal. To enhance signal reliability, volume is used for filtering. Buy signals require the current volume to be significantly higher than the average level (set by a user-defined percentage above the 21-period EMA of volume), suggesting strong buying interest. Conversely, sell signals require the current volume to be lower, indicating reduced selling pressure.
The RSI (14-period by default) serves as a momentum filter. Buy signals are only considered when the RSI is above 50, indicating bullish momentum, while sell signals are considered when the RSI is below 50, highlighting bearish momentum.
The strategy utilizes the Average True Range (ATR) to dynamically set stop-loss levels based on current market volatility. This method helps manage risk by adjusting stop levels according to market conditions.
Buy signals are generated when the price crosses above the 21 EMA, the volume is above the threshold, and the RSI is above 50. The strategy enters a long position with a dynamic stop-loss set below the entry price, determined by the ATR.
Sell signals occur when the price crosses below the 21 EMA, the volume is below the threshold, and the RSI is below 50. The strategy enters a short position with a stop-loss set above the entry price, also determined by the ATR.
Strategy Advantages
-
Multiple Indicator Combination: The strategy combines trend, volume, and momentum indicators to provide a more comprehensive market analysis, helping to filter out false signals.
-
Dynamic Stop-Loss: By adjusting stop-loss levels based on ATR, the strategy can better adapt to different market conditions, aiding in risk control.
-
Adaptability: The strategy can be applied to various financial instruments and time frames, allowing traders to adjust it according to their trading style and risk tolerance.
-
Trend Following: By capturing the main trend using the 21 EMA, the strategy enables traders to align with the market direction.
Strategy Risks
-
Parameter Optimization: The strategy's performance heavily relies on the optimization of input parameters, including the volume threshold percentage, RSI levels, and ATR multiplier. Improper parameter settings may lead to suboptimal strategy performance.
-
Choppy Markets: In markets with high volatility and no clear trend, the strategy may generate more false signals, resulting in frequent trades and potential losses.
-
Unexpected Events: Abnormal market events, such as major news announcements or economic data releases, can cause sharp price and volume fluctuations, affecting the strategy's performance.
Optimization Directions
-
Multiple Timeframe Confirmation: Consider applying the strategy on different time frames (e.g., 1-hour, 4-hour, daily) and look for signals that are consistent across multiple timeframes to improve reliability.
-
Profit-Taking Rules: Incorporate profit-taking rules into the current strategy, such as setting profit targets based on risk-reward ratios or price objectives, to lock in profits and optimize strategy returns.
-
Additional Filters: Explore adding other technical indicators as filters, such as MACD, Bollinger Bands, etc., to further confirm trends and momentum.
-
Market Environment Adaptation: Adjust strategy parameters based on different market states (e.g., trending, rangebound, high volatility) to adapt to changing market conditions.
Conclusion
The trend momentum strategy based on the 21 EMA, volume, and RSI is a multi-indicator approach designed to capture trends and utilize volume and momentum confirmation to improve signal quality. Through dynamic stop-loss and parameter optimization, the strategy can adapt to different market conditions and manage risk. However, traders should be aware of the risks of over-optimization and frequent trading and make adjustments based on their risk tolerance and trading objectives.
The strategy provides a systematic framework that considers multiple dimensions, including trend, volume, and momentum, to inform trading decisions. By backtesting and optimizing, traders can further enhance the strategy's performance and make dynamic adjustments based on changing market states. Additionally, combining the strategy with fundamental analysis and risk management principles can form a more comprehensive trading approach.
Overall, the trend momentum strategy based on the 21 EMA, volume, and RSI is a flexible and customizable trading method suitable for traders pursuing trend trading and seeking to improve signal reliability through multiple indicator confirmations. When applying the strategy in practice, traders should carefully assess their risk tolerance, conduct thorough backtesting and optimization, and ensure that it aligns with their trading goals and market environment.
- 1