1-2-3 Pattern Quantitative Trading Strategy with EMAs, MACD, and 4th Candle Extension

Overview
This strategy, written in Pine Script, aims to identify potential buy and sell signals based on the 1-2-3 pattern, combined with additional conditions involving Exponential Moving Averages (EMAs) and the Moving Average Convergence Divergence (MACD) indicator. The strategy leverages price patterns, trend confirmation, and momentum indicators to provide comprehensive trading signals.
Strategy Logic
The core of this strategy is to identify the 1-2-3 pattern, which is a common price pattern consisting of three consecutive candles, indicating a potential trend reversal. For buy signals, the first candle closes above its open, the second candle closes below its open, the third candle closes above the close of the first candle, and finally, the fourth candle closes above the close of the third candle. The conditions for sell signals are the exact opposite.
In addition to the 1-2-3 pattern, the strategy employs EMA and MACD indicators to confirm the trend direction and potential trend reversals. The 9-period EMA and 20-period EMA are used for trend confirmation, while the MACD line and signal line are used to identify momentum and potential trend reversals.
When all the buy conditions are met, i.e., the 1-2-3 pattern is formed, the close price is above both EMAs, and the MACD line is above the signal line, the strategy opens a long position. Similarly, when all the sell conditions are met, the strategy opens a short position. The strategy closes the respective positions when the opposite signal is generated or when the current candle closes in the opposite direction of the position.
Advantages Analysis
- Combines price patterns, trend confirmation, and momentum indicators to provide comprehensive trading signals.
- The 1-2-3 pattern is a common and reliable price pattern that can effectively capture potential trend reversals.
- Utilizes EMA and MACD indicators to further confirm the trend direction and momentum, enhancing the reliability of the signals.
- Clear entry and exit rules, making it easy to understand and implement.
Risk Analysis
- The strategy relies on a single timeframe, potentially missing important information from other timeframes.
- May generate false signals during choppy markets or when the trend is unclear.
- Does not consider risk management, such as stop-loss and position sizing, which could lead to significant losses.
- The strategy parameters are not optimized and may not be suitable for all market conditions.
Optimization Direction
- Incorporate multi-timeframe analysis to confirm trend consistency across different time scales.
- Implement risk management measures, such as dynamic stop-loss based on Average True Range (ATR) and position sizing.
- Optimize the strategy parameters, such as the period settings for EMAs and MACD, to adapt to different market conditions.
- Consider adding other technical indicators or market sentiment indicators to enhance signal reliability.
Summary
This strategy, based on the 1-2-3 pattern, EMAs, and MACD indicators, provides a comprehensive approach to identify potential buy and sell signals. It combines price patterns, trend confirmation, and momentum indicators to generate reliable trading signals. However, the strategy also has some limitations, such as the lack of risk management measures and parameter optimization. By incorporating multi-timeframe analysis, dynamic stop-loss, position sizing, and parameter optimization, the strategy's performance can be further improved. Additionally, including other technical indicators or market sentiment indicators can also help to enhance the reliability of the signals. Despite these potential improvements, the strategy still needs to be thoroughly backtested and validated before applying it to live trading. Overall, this strategy provides a good starting point for traders and, with further optimization and refinement, has the potential to become a robust and profitable trading strategy.
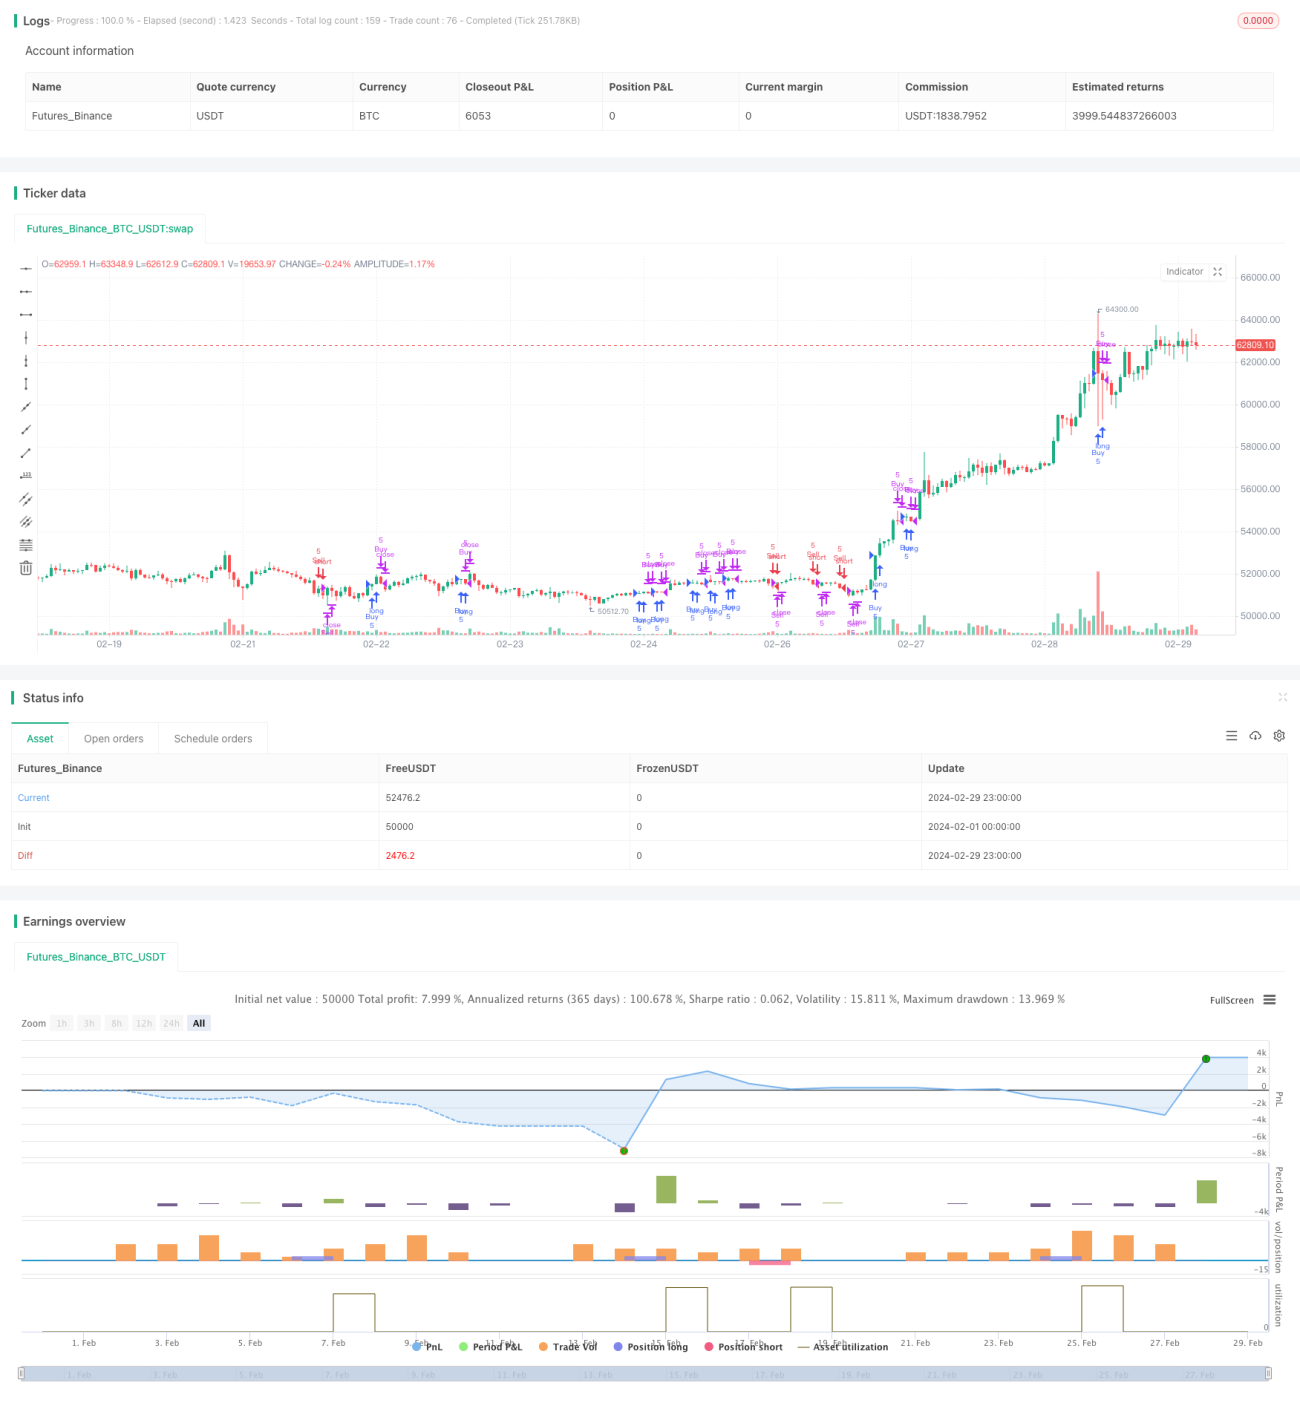
/*backtest
start: 2024-02-01 00:00:00
end: 2024-02-29 23:59:59
period: 1h
basePeriod: 15m
exchanges: [{"eid":"Futures_Binance","currency":"BTC_USDT"}]
*/

//@version=5
strategy("1-2-3 Pattern Strategy with EMAs, MACD, and 4th Candle Extension", overlay=true)

// Define conditions for the 1-2-3 pattern for buy orders- 1