RSI-based Long Strategy with Trailing Stop for Quantitative Trading

Overview
This article introduces a quantitative trading strategy for going long based on the Relative Strength Index (RSI) and trailing stop. The strategy uses the RSI indicator to determine overbought and oversold market conditions, entering long positions when the market is oversold and closing positions when it is overbought. At the same time, the strategy employs a percentage-based trailing stop to control risk. This is a classic trend-following strategy designed to capture uptrends in strong markets.
Strategy Principles
The core of this strategy is the Relative Strength Index (RSI). RSI is a momentum oscillator used to measure the magnitude of price changes over a period of time. Its calculation formula is:
RS = Average gain over N days / Average loss over N days
RSI = 100 - 100 / (1 + RS)
where N is the time period for calculating RSI, usually set to 14.
The strategy logic is as follows:
- Calculate the N-period RSI.
- When RSI crosses above the oversold level (e.g., 30) from below, enter a long position.
- When RSI crosses below the overbought level (e.g., 70) from above, close the long position.
- Upon entry, calculate the stop loss price based on the current price and the set percentage.
- If the price reaches the stop loss price, close the long position to control losses.
The strategy attempts to enter positions at the beginning of a market transition from bearish to bullish, and exit at the end of a bull market, in order to capture the main uptrend.
Advantage Analysis
- Simplicity: The strategy only uses one technical indicator, RSI, with clear logic, making it suitable for beginners to learn and use.
- Trend following: The strategy enters positions in the oversold zone and exits in the overbought zone, adhering to the "buy low, sell high" principle of trend investing, effectively capturing bull market uptrends.
- Risk control: The percentage-based trailing stop helps investors control the risk exposure of each trade, limiting losses to an acceptable range.
Risk Analysis
- Losses in range-bound markets: RSI is a lagging indicator and may generate many false signals in range-bound markets, leading to frequent entries and exits that accumulate small losses into large ones.
- Improper stop loss setting: If the stop loss is set too wide, the loss per trade will be large; if it is set too narrow, the strategy will stop out too early and miss subsequent trends.
- Lack of position management: The strategy lacks a mechanism for dynamically adjusting positions, resulting in inflexible risk exposure control.
Optimization Directions
- Trend filtering: Before using RSI signals, first determine the long-term trend using moving averages or other trend indicators, and only use RSI long signals when the major trend is up.
- Stop loss optimization: Consider using trailing stops or more advanced stop loss strategies such as ATR to dynamically adjust stop loss positions to better fit market rhythm.
- Position management: Dynamically adjust the size of each trade based on factors such as market volatility and trend strength to better control risk.
- Long-short hedging: While using the long strategy, introduce a short strategy for hedging to reduce the overall risk exposure of the strategy.
Conclusion
This article presented a quantitative trading strategy for going long based on RSI and trailing stops. The strategy uses RSI overbought and oversold signals to enter and exit positions, while using percentage-based trailing stops to control risk. This is a simple and practical trend-following strategy suitable for beginners to learn. However, it also has some limitations, such as poor performance in range-bound markets and lack of flexibility in stop loss and position management. To address these shortcomings, we can optimize the strategy in aspects such as trend filtering, dynamic stop loss, position management, and long-short hedging, in order to obtain more robust returns. The development of quantitative trading strategies is a process of continuous optimization and iteration, requiring investors to constantly summarize experiences and refine the strategy in practice.
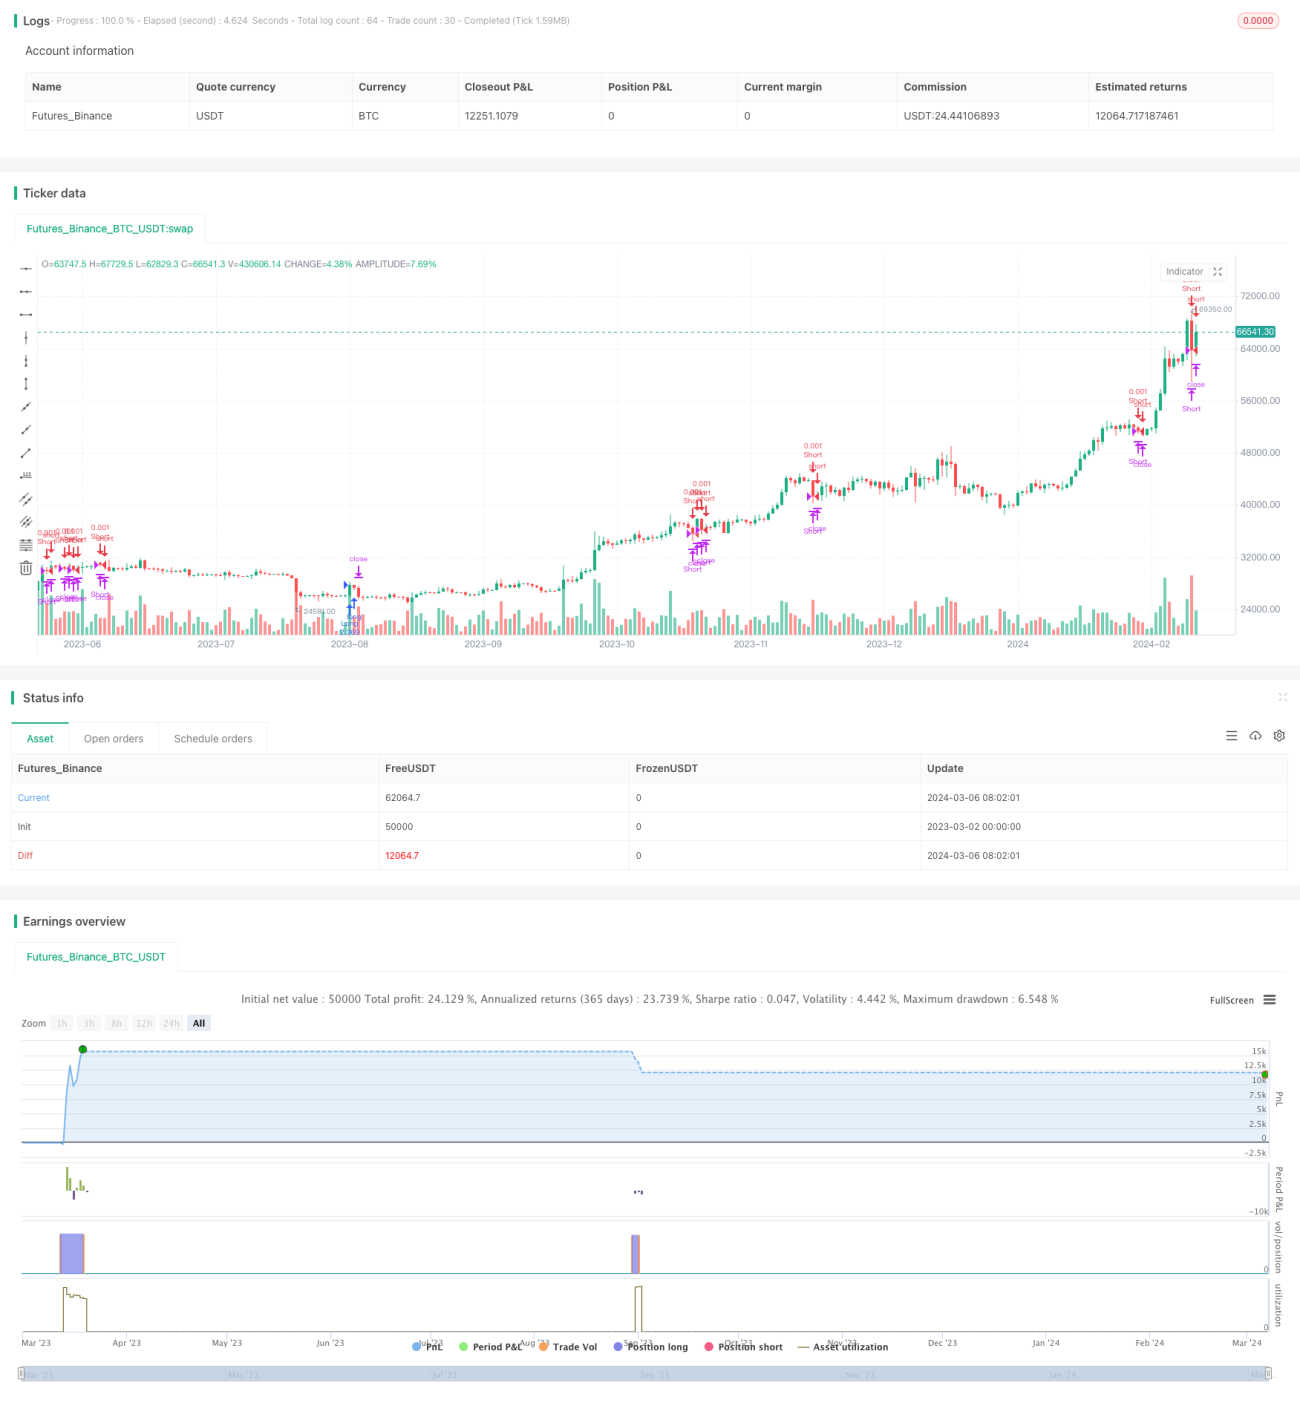
/*backtest
start: 2023-03-02 00:00:00
end: 2024-03-07 00:00:00
period: 1d
basePeriod: 1h
exchanges: [{"eid":"Futures_Binance","currency":"BTC_USDT"}]
*/

//@version=5
strategy("RSI Strategy (Long)", overlay=true, initial_capital=1000, default_qty_type=strategy.percent_of_equity, default_qty_value=100)
length = input( 14 )
overSold = input( 30 )- 1