JiaYiBing Quantitative Trend Momentum Trading Strategy

Overview
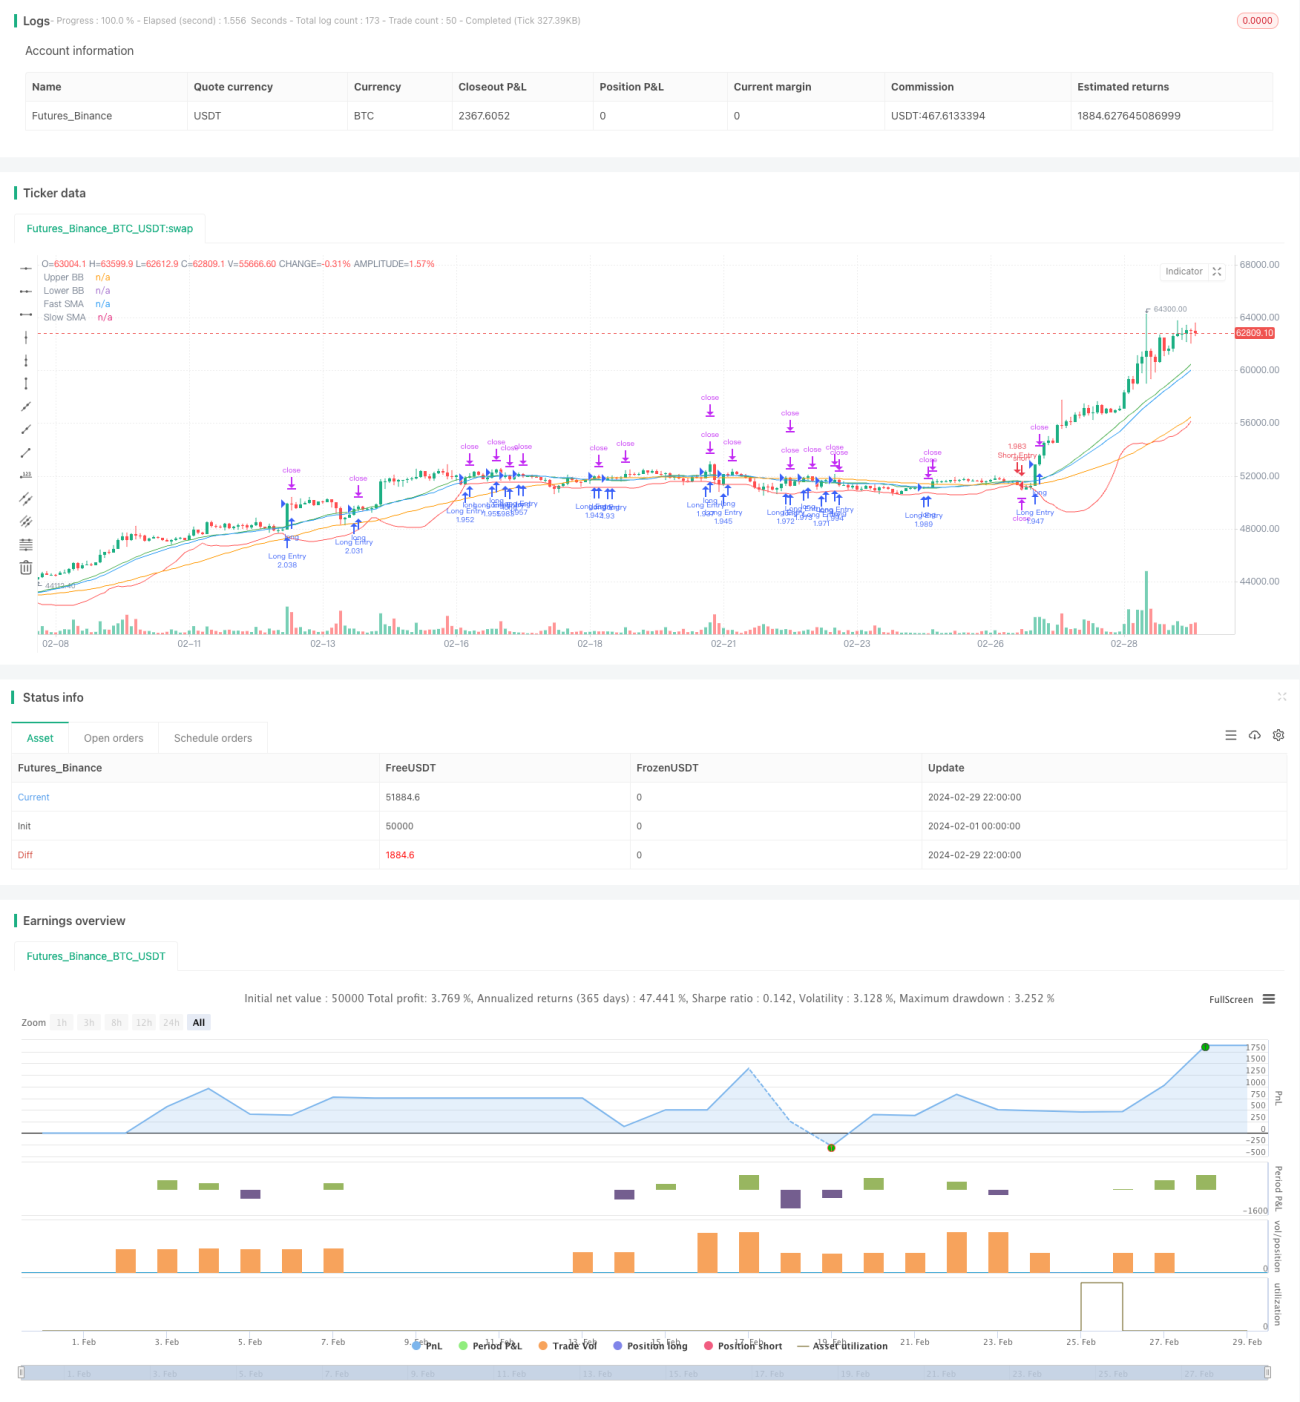
The JiaYiBing Quantitative Trend Momentum Trading Strategy is a long-short quantitative trading strategy that combines trend tracking, momentum indicators, and Bollinger Bands channels. The strategy uses the crossover of fast and slow moving averages to determine the trend direction, and confirms entry signals based on Bollinger Bands channels and momentum indicators. The strategy also includes risk control measures such as take profit, stop loss, trailing stop, and position sizing.
Strategy Principles
The core principle of this strategy is to capture market opportunities by leveraging price trends and momentum effects. Specifically, the strategy uses two moving averages with different periods (fast and slow) to determine the direction of the price trend. When the fast moving average crosses above the slow moving average, it indicates an upward trend and the strategy generates a long signal; conversely, when the fast moving average crosses below the slow moving average, it indicates a downward trend and the strategy generates a short signal.
To further confirm the trend and entry timing, the strategy also incorporates Bollinger Bands and momentum indicators. Bollinger Bands consist of three lines: the middle line is the moving average, while the upper and lower bands are a certain number of standard deviations above and below the middle line. When the price breaks above the upper Bollinger Band, it indicates strong upward momentum and the strategy will go long; when the price breaks below the lower Bollinger Band, it indicates strong downward momentum and the strategy will go short.
In addition, the strategy also introduces a momentum indicator, which measures the speed of price changes by comparing the current price with the price a certain period ago. The momentum indicator can be used to judge the strength of the trend and provide additional confirmation for entry.
In terms of position sizing, the strategy allows for setting the position size based on account equity and risk preference. At the same time, the strategy also includes take profit, stop loss, and trailing stop mechanisms to control the risk exposure of each trade.
Overall, the JiaYiBing Quantitative Trend Momentum Trading Strategy seeks to capture trending market opportunities while strictly controlling risk through multiple dimensions such as trend tracking, momentum confirmation, and risk management, in order to achieve stable investment returns.
Advantage Analysis
-
Trend Tracking: The strategy uses the crossover of fast and slow moving averages to capture trending price opportunities, allowing it to go long in uptrends and short in downtrends, adapting to different market conditions.
-
Momentum Confirmation: The introduction of the momentum indicator as a secondary confirmation of the trend helps to filter out false signals and improve entry quality.
-
Bollinger Bands Assisted Decision-Making: Bollinger Bands can reflect the price volatility range, and breakouts of Bollinger Bands can be seen as signals of trend acceleration or abnormal price fluctuations, providing a reference for entry.
-
Position Sizing: The strategy employs a position sizing method based on a percentage of account equity and a maximum limit, allowing for flexible control of the capital employed in each trade, both fully utilizing funds and avoiding excessive risk exposure.
-
Take Profit and Stop Loss: The strategy sets take profit, stop loss, and trailing stop loss levels, which can protect profits when the price moves in the expected direction, and decisively cut losses when the price reverses, effectively controlling the maximum loss of each trade.
-
Multi-Parameter Optimization: The strategy includes multiple adjustable parameters, such as moving average periods, Bollinger Bands parameters, take profit and stop loss percentages, etc., which can be optimized to improve the adaptability and robustness of the strategy.
Risk Analysis
-
Frequent Trading: The strategy generates entry signals based on moving average crossovers and Bollinger Band breakouts. When market volatility is high, it may frequently generate trading signals, leading to excessive trading frequency and increasing commission and slippage costs.
-
Parameter Sensitivity: The strategy includes multiple parameters, such as moving average periods, momentum periods, Bollinger Bands parameters, etc. The choice of different parameters can have a significant impact on the performance of the strategy. If the parameters are not properly selected, it may lead to poor strategy performance.
-
Lagging Trend Recognition: Moving averages are lagging indicators, especially when the moving average period is long, the speed of identifying trend reversals will be slower, and the best entry timing may be missed.
-
Stop Loss Risk: Although the strategy sets stop loss measures, in extreme market conditions (such as rapid gaps), the price may directly cross the stop loss level, resulting in actual losses exceeding expectations.
-
Concentrated Position Risk: If the strategy continuously generates signals in the same direction during a certain period, it may lead to excessive concentration of positions in one direction, facing greater position risk.
-
Liquidity Risk: The performance of the strategy in backtesting and live trading may be affected by market liquidity, especially when dealing with large funds, which may face issues of slippage and insufficient trading volume.
Optimization Directions
-
Introduce More Technical Indicators: On the basis of the current moving averages, momentum, and Bollinger Bands, more technical indicators such as RSI and MACD can be introduced to improve the reliability of signals through multi-indicator confirmation.
-
Optimize Entry and Exit Mechanisms: More conditions can be introduced in the judgment of entry and exit, such as requiring a certain trading volume before price breakouts, using staged position closing or trailing take profit for exits, to enhance the flexibility and profitability of the strategy.
-
Dynamic Parameter Adjustment: For moving average periods, momentum periods, Bollinger Bands parameters, etc., a set of parameter adaptive mechanisms can be designed to dynamically adjust parameter values based on different market states and volatility levels, improving the adaptability of the strategy.
-
Improve Position Sizing: On the basis of current position sizing, more advanced money management methods such as Kelly Criterion, fixed ratio, dynamic equity, etc. can be introduced to better balance returns and risks.
-
Combine with Fundamental Analysis: Pure technical analysis strategies may face the risk of market inefficiency or failure. If some fundamental factors, such as macroeconomic data and industry trends, can be combined to filter and confirm technical signals, it may improve the performance of the strategy.
-
Enhance the Consistency of Backtesting and Live Trading: The performance of the strategy in backtesting and live trading may differ. It is necessary to focus on the execution quality of backtesting and live trading, including factors such as execution price, slippage, and latency, to ensure the consistency of live performance with backtesting results.
Summary
The JiaYiBing Quantitative Trend Momentum Trading Strategy is a quantitative trading strategy that integrates multiple technical analysis methods. It uses moving average crossovers to capture trends
- 1