MACD Moving Average Bullish Quantitative Trading Strategy

Overview
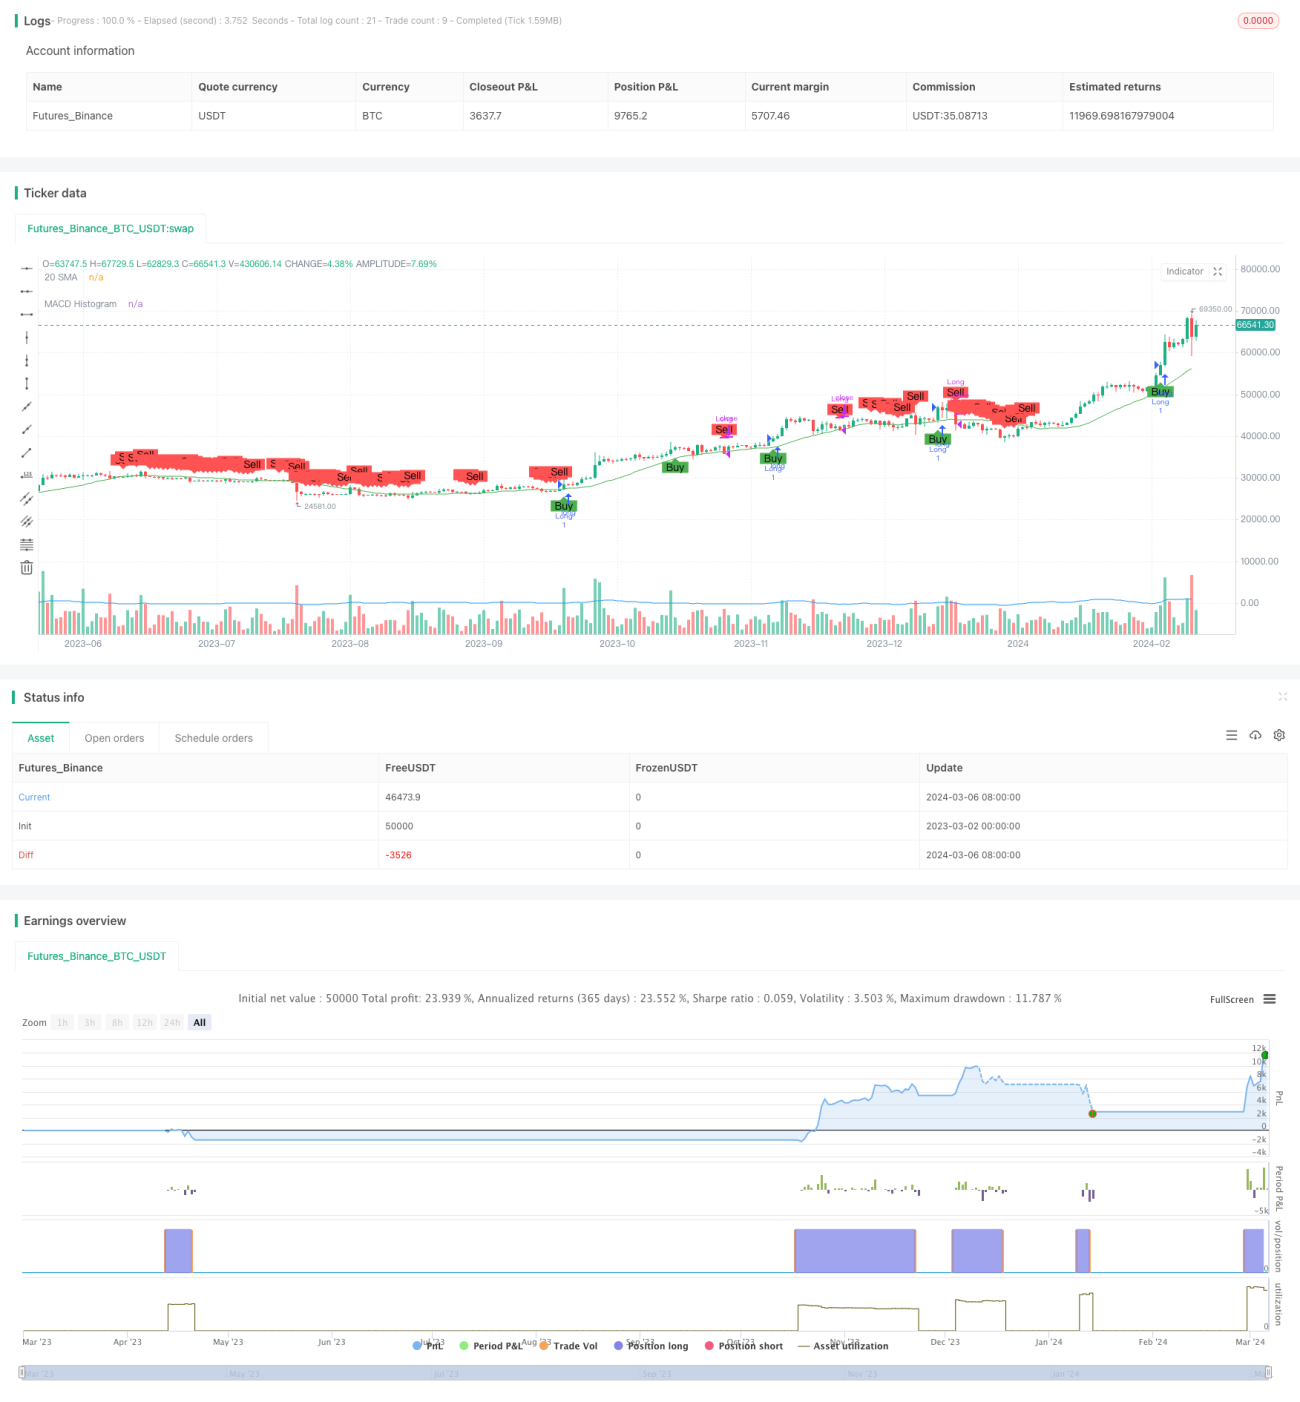
The MACD Moving Average Bullish Quantitative Trading Strategy is a quantitative trading strategy based on the MACD indicator and the 20-day moving average. The strategy determines buy and sell signals by analyzing the crossover relationship between the short-term and long-term lines of the MACD indicator and the position of the stock price relative to the 20-day moving average. A buy signal is generated when the MACD short-term line crosses above the long-term line and is above the zero line, and simultaneously, the stock's closing price is higher than the 20-day moving average. A sell signal is generated when the stock's closing price falls below the 20-day moving average.
Strategy Principle
The principles of the MACD Moving Average Bullish Quantitative Trading Strategy are as follows:
- Calculate the MACD indicator: By setting three parameters of MACD (short period, long period, and signal period), calculate the fast line (MACD line) and slow line (signal line) of MACD.
- Calculate the 20-day moving average: By setting the period of the 20-day moving average, calculate the 20-day moving average value of the stock price.
- Determine buy condition: When the MACD fast line crosses above the MACD slow line, and the fast line is above the zero line, while the stock's closing price is higher than the 20-day moving average, a buy signal is generated.
- Determine sell condition: When the stock's closing price falls below the 20-day moving average, a sell signal is generated.
- Record entry price: When the buy condition is met, record the current stock price as the entry price.
- Execute trades: Based on the buy and sell signals, execute corresponding trading operations, buying or selling stocks.
The strategy utilizes two technical indicators, the MACD indicator and moving average, to determine market trends and trading timing. The MACD indicator is used to capture changes in market momentum, while the moving average is used to confirm price trends. When both indicators send signals in the same direction, the trend is considered more certain, and trading signals are generated.
Advantage Analysis
The MACD Moving Average Bullish Quantitative Trading Strategy has the following advantages:
- Trend tracking: The strategy uses the MACD indicator and moving average to determine market trends, effectively tracking the main market trends and avoiding frequent trades in choppy markets.
- Signal confirmation: The strategy uses both the MACD indicator and moving average, two technical indicators, to improve the reliability of trading signals through their mutual confirmation, reducing false signals.
- Simple and easy to use: The strategy rules are simple and clear, easy to understand and implement, suitable for traders at different levels.
- Flexible parameters: The MACD parameters and moving average period in the strategy can be adjusted according to different market environments and trading instruments to optimize strategy performance.
Risk Analysis
Although the MACD Moving Average Bullish Quantitative Trading Strategy has its advantages, it still has some risks:
- Lag in trend recognition: Both the MACD indicator and moving average are lagging indicators, and there is a certain delay in their recognition of market trends. When the market changes rapidly, the strategy may experience lag, leading to missed optimal trading opportunities or false signals.
- Poor performance in choppy markets: The strategy may generate frequent trading signals in choppy markets, resulting in increased trading frequency and reduced profits. The strategy performs better in trending markets but may face more challenges in choppy markets.
- Sensitivity to parameter settings: The performance of the strategy depends to a certain extent on the choice of MACD parameters and moving average period. Inappropriate parameter settings may lead to poor strategy performance.
To address these risks, the following solutions can be considered:
- Combine with other indicators: Add other technical indicators to the strategy, such as RSI, Bollinger Bands, etc., to assist in judging market trends and trading timing, improving the adaptability of the strategy.
- Optimize parameters: By backtesting historical data and optimizing parameters, find the optimal parameter combination suitable for different market environments and trading instruments, improving the robustness of the strategy.
- Set stop-loss: Incorporate a stop-loss mechanism in the strategy. When a certain level of loss occurs in a trade, close the position in a timely manner to control risk and reduce the maximum loss of a single trade.
Optimization Direction
To further improve the performance of the MACD Moving Average Bullish Quantitative Trading Strategy, the following optimization directions can be considered:
- Dynamic parameter optimization: Adjust strategy parameters in real-time according to changes in market conditions, such as MACD period parameters and moving average period. Adaptive algorithms or machine learning methods can be used to achieve dynamic optimization of parameters to adapt to different market environments.
- Incorporate risk management: Introduce risk management modules into the strategy, such as position management and money management, dynamically adjusting position size based on market volatility and account risk, controlling overall risk exposure.
- Long-short dual-direction trading: Currently, the strategy only considers long trading. It can be extended to long-short dual-direction trading, performing short selling operations when the market trend is judged to be downward, to capture more trading opportunities.
- Multi-timeframe analysis: Introduce multi-timeframe analysis into the strategy, such as considering MACD indicators and moving averages of different timeframes like daily and hourly simultaneously, improving the reliability of trading signals through confirmation from multiple timeframes.
- Combine with other strategies: Combine the MACD Moving Average Bullish strategy with other quantitative trading strategies, such as trend following strategies, mean reversion strategies, etc., to improve overall returns and stability through strategy combination.
These optimization directions can help improve the strategy's adaptability, risk management capability, and profit potential, enabling the strategy to perform better in different market environments. Through continuous optimization and improvement, the MACD Moving Average Bullish Quantitative Trading Strategy can become more robust and effective.
Summary
The MACD Moving Average Bullish Quantitative Trading Strategy is a trend-following strategy that combines the MACD indicator and moving average. It generates buy and sell signals by analyzing the crossover relationship of the fast and slow lines of the MACD indicator and the position of the stock price relative to the moving average. The strategy's advantages lie in trend tracking, signal confirmation, simplicity, ease of use, and parameter flexibility. However, it also has risks such as lag in trend recognition, poor performance in choppy markets, and sensitivity to parameter settings. To improve the strategy, methods such as combining with other indicators, optimizing parameters, and setting stop-losses can be considered. Furthermore, the strategy can be further optimized through dynamic parameter optimization, incorporating risk management, long-short dual-direction trading, multi-timeframe analysis, and combining with other strategies. Overall, the MACD Moving Average Bullish Quantitative Trading Strategy provides investors with a simple and effective trading tool. Through continuous optimization and improvement, the strategy's adaptability and robustness can be enhanced, helping investors achieve better trading results in different market environments.
- 1