Multi-Stage Bollinger Bands-MACD Crossover Signal Quantitative Trading Strategy

Strategy Overview
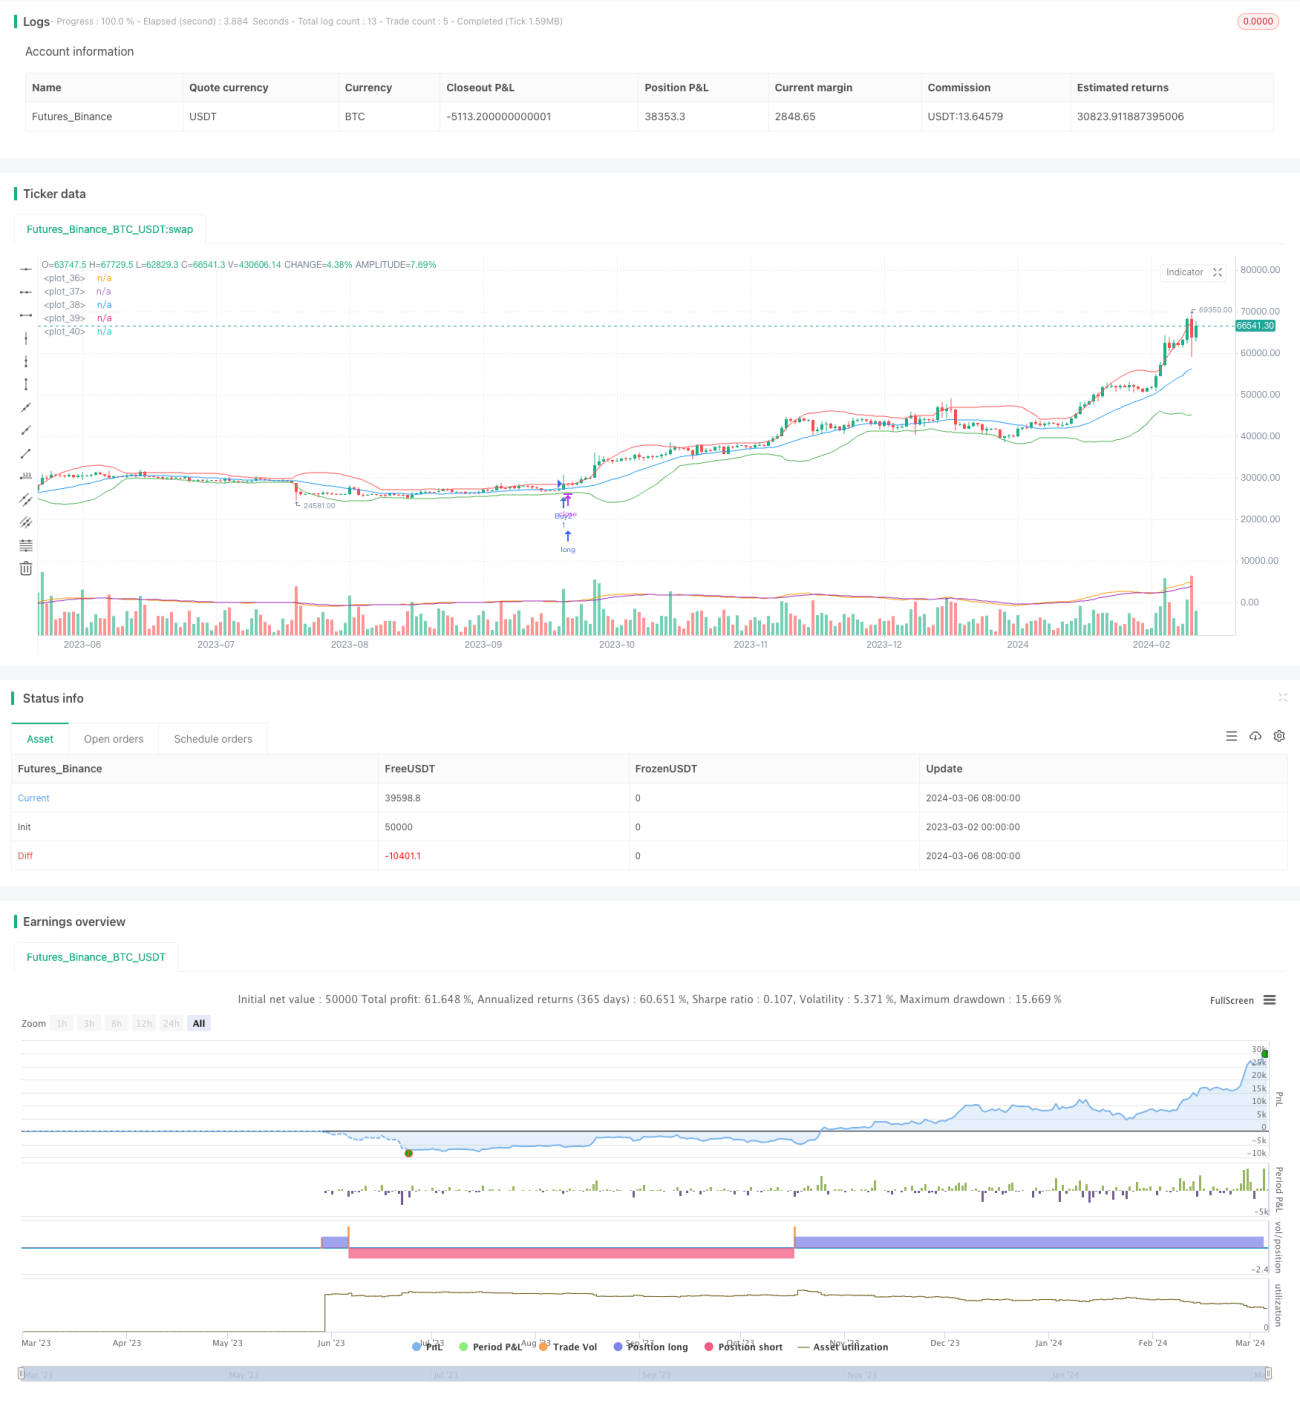
This strategy combines multi-stage Bollinger Bands and MACD indicator to identify trading opportunities by detecting price crossovers with the upper and lower bands of Bollinger Bands along with MACD crossover signals, executing different trading strategies under different market conditions. When the price breaks above the upper Bollinger Band and MACD shows a bullish crossover, the strategy opens a long position; when the price breaks below the lower Bollinger Band and MACD shows a bearish crossover, the strategy opens a short position. This strategy aims to capture trending opportunities in the market while using MACD crossover signals to confirm the validity of the trend, thus improving the win rate and profitability of trading.
Strategy Principle
The core principle of this strategy is to use the crossover signals of Bollinger Bands and MACD indicator to identify trending opportunities in the market. Specifically:
-
Bollinger Bands consist of a middle band, an upper band, and a lower band, representing the moving average of price, upper standard deviation, and lower standard deviation, respectively. When the price breaks above the upper Bollinger Band, it indicates that the market may enter a strong upward trend; when the price breaks below the lower Bollinger Band, it indicates that the market may enter a strong downward trend.
-
The MACD indicator consists of the difference between two exponential moving averages (EMAs) of price (i.e., MACD line) and the 9-day EMA of the MACD line (i.e., signal line). When the MACD line crosses above the signal line, it indicates that the market may enter an upward trend; when the MACD line crosses below the signal line, it indicates that the market may enter a downward trend.
-
This strategy combines the crossover signals of Bollinger Bands and MACD indicator. When the price breaks above the upper Bollinger Band and MACD shows a bullish crossover, it opens a long position; when the price breaks below the lower Bollinger Band and MACD shows a bearish crossover, it opens a short position. This multi-condition trading signal can effectively improve the accuracy and reliability of trading.
-
In addition, this strategy introduces the Average True Range (ATR) indicator to measure market volatility. The strategy opens a position only when the price breaks above the upper Bollinger Band and is higher than the middle band + ATR, or when the price breaks below the lower Bollinger Band and is lower than the middle band - ATR. This additional condition can further confirm the strength of the trend and avoid frequent trading in less volatile markets.
Strategy Advantages
-
Strong trend-following ability: By using the crossover signals of Bollinger Bands and MACD indicator, this strategy can effectively capture trending opportunities in the market and open positions at the early stage of trend formation, thus obtaining greater profit potential.
-
Reliable trading signals: This strategy adopts multi-condition trading signals, including price breakout of Bollinger Bands, MACD crossover, and ATR confirmation, which can effectively improve the accuracy and reliability of trading signals and reduce losses caused by false signals.
-
High adaptability: This strategy can be applied to different market environments and asset classes, such as stocks, futures, and forex. By adjusting parameter settings, the strategy's performance in different markets can be optimized.
-
Risk control: This strategy introduces the ATR indicator to measure market volatility and avoids opening positions when the trend is unclear or volatility is low, thus controlling trading risks.
Strategy Risks
-
Parameter setting risk: The performance of this strategy depends on the parameter settings of Bollinger Bands and MACD indicator. Improper parameter settings may lead to invalid trading signals or frequent trading, thus affecting the strategy's profitability. Therefore, it is necessary to optimize parameter settings according to different market characteristics and asset classes.
-
Trend reversal risk: This strategy is mainly applicable to trending markets. If the market experiences frequent trend reversals or rangebound movements, the strategy's performance may be affected. To deal with this risk, other technical indicators or signal filtering mechanisms can be introduced to identify the validity of the trend.
-
Loss amplification risk: This strategy opens positions at the early stage of trend formation. If the judgment is wrong or the trend suddenly reverses, it may lead to amplified losses. To control this risk, reasonable stop-loss levels can be set, or dynamic position management methods such as trailing stop-loss or position adjustment can be adopted.
Strategy Optimization Directions
-
Parameter optimization: The performance of this strategy depends on the parameter settings of Bollinger Bands and MACD indicator. The optimal parameter combination can be found through historical data backtesting and parameter optimization to improve the stability and profitability of the strategy.
-
Signal filtering: To reduce false signals and frequent trading, other technical indicators or signal filtering mechanisms can be introduced, such as trend indicators, moving average systems, or time filters, to confirm the validity and sustainability of the trend.
-
Position management: This strategy can adopt more dynamic and flexible position management methods, such as adjusting position size based on market volatility or trend strength, or using multi-level positions and pyramid position building methods to optimize the risk-reward ratio of the strategy.
-
Combined strategies: This strategy can be combined with other types of trading strategies, such as mean reversion strategies, seasonal strategies, or event-driven strategies, to improve the adaptability and stability of the strategy and achieve risk diversification and return enhancement.
Summary
The quantitative trading strategy based on multi-stage Bollinger Bands and MACD indicator is a trend-following strategy that opens positions at the early stage of trend formation through the crossover signals of Bollinger Bands and MACD indicator, as well as the confirmation of ATR indicator, to obtain greater profit potential. This strategy has advantages such as strong trend-following ability, reliable trading signals, high adaptability, and risk control, while also having risks such as parameter setting risk, trend reversal risk, and loss amplification risk. To further improve the performance of the strategy, optimization and improvement can be made in aspects such as parameter optimization, signal filtering, position management, and combined strategies. Overall, this strategy is suitable for traders who pursue trending opportunities, but it needs to be flexibly adjusted and optimized according to market characteristics and risk preferences to obtain stable and sustainable trading returns.
- 1