Crypto Pullback Trading Strategy Based on Stochastic RSI and EMA Crossover

Strategy Overview
This strategy combines Stochastic RSI and EMA to detect trends and verify trading signals. When the price retraces above EMA20 to between EMA9 and EMA14, and the Stochastic RSI is below the oversold level, a long signal is generated; when the price retraces below EMA20 to between EMA9 and EMA14, and the Stochastic RSI is above the overbought level, a short signal is generated.
Strategy Principles
- Use the ta.ema function to calculate 3 EMAs with different periods, namely EMA9, EMA14, and EMA20, to determine the trend state of the price.
- Use the ta.rsi function to calculate the RSI indicator, then use the ta.stoch function to convert the RSI to the Stochastic RSI indicator to determine whether the price is overbought or oversold.
- When the closing price > EMA20 and the closing price < EMA9 and EMA14, and the Stochastic RSI < oversold level, a long signal is triggered and a buy operation is executed.
- When the closing price < EMA20 and the closing price > EMA9 and EMA14, and the Stochastic RSI > overbought level, a short signal is triggered and a sell operation is executed.
The core idea of this strategy is to use the Stochastic RSI to determine whether the price retracement in the main trend (represented by EMA20) has reached an appropriate overbought or oversold area, while using the fast EMA and medium EMA to verify the strength of the retracement. If the price breaks through the fast EMA and medium EMA, the retracement may end and the trend may reverse, which is not suitable for entering a position. Only when the price retraces between EMA9 and EMA14 is it considered to enter a position in the direction of the trend. This multi-condition verification method can effectively improve signal quality and reduce misjudgments.
Strategy Advantages
- Combines trend indicators (EMA) and oscillator indicators (RSI) to better grasp trend and overbought/oversold timing.
- Adopts Stochastic RSI, which has two advantages compared to the original RSI indicator: one is increased smoothness of the indicator, and the other is avoiding the indicator sticking to extreme values for a long time.
- Multi-condition verification can effectively filter out many false signals and improve the reliability of signals.
- The code logic is clear and simple, easy to understand and modify, and can be used as a template for beginners to learn.
Strategy Risks
- Not suitable for sideways markets, because the EMAs frequently cross over, which may produce many false signals.
- If the trend is very strong and the price rises or falls unilaterally, this strategy will miss many opportunities because the retracement is very shallow.
- The selection of EMA parameters has a great impact on the strategy and needs to be adjusted separately for different varieties and periods.
- The Stochastic RSI parameters also need to be adjusted according to the actual situation, and the current default values may not work well on some varieties.
Optimization Directions
- Consider introducing the ATR indicator to dynamically adjust the overbought and oversold levels to adapt to different volatility levels.
- Add more EMAs with different periods to more accurately describe the position of price retracements.
- Stop loss and take profit must also be considered, using percentage stop loss or ATR stop loss, and trailing stop loss to protect profits.
- Candlestick patterns such as pin bars and engulfing patterns can be used to assist in judging trend reversals as supplementary conditions to improve accuracy.
Summary
This strategy uses Stochastic RSI combined with EMA multi-condition verification to effectively control risk while grasping trend retracements. The overall idea is simple and easy to understand, suitable for beginners to learn and use. However, the strategy itself also has some limitations, such as poor performance in sideways markets, insufficient grasp of trend movements, etc., which need to be flexibly adjusted according to the actual situation. In the future, consideration can also be given to optimizing and improving the strategy from aspects such as dynamic parameters, more indicator verification, and money management to obtain more robust returns. In general, this strategy can serve as a basic template that can be modified and expanded upon, and is a good starting point and learning material.
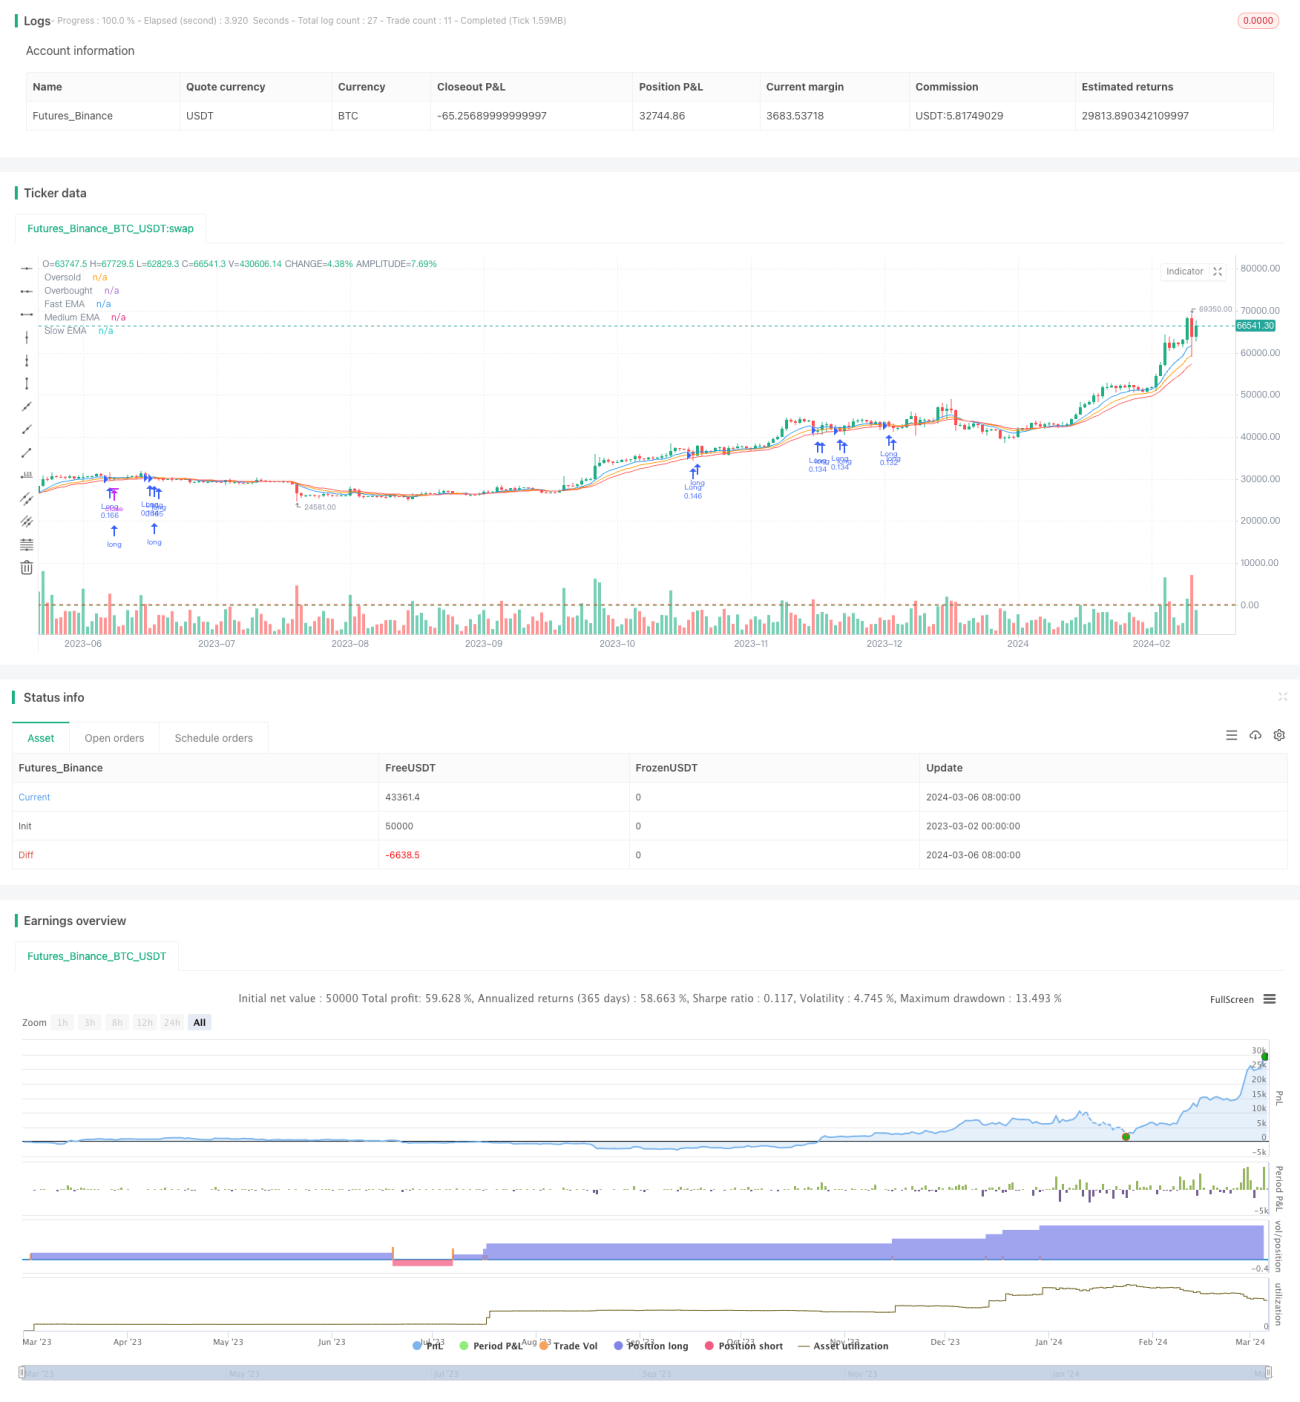
/*backtest
start: 2023-03-02 00:00:00
end: 2024-03-07 00:00:00
period: 1d
basePeriod: 1h
exchanges: [{"eid":"Futures_Binance","currency":"BTC_USDT"}]
*/

//@version=5
strategy("Crypto-EMA_Pullback=-", overlay=true,initial_capital = 10000000,default_qty_type=strategy.percent_of_equity, default_qty_value=10.0, pyramiding = 10)

// Inputs- 1