Quantitative Trading Strategy Based on Stochastics Momentum Index

Strategy Overview
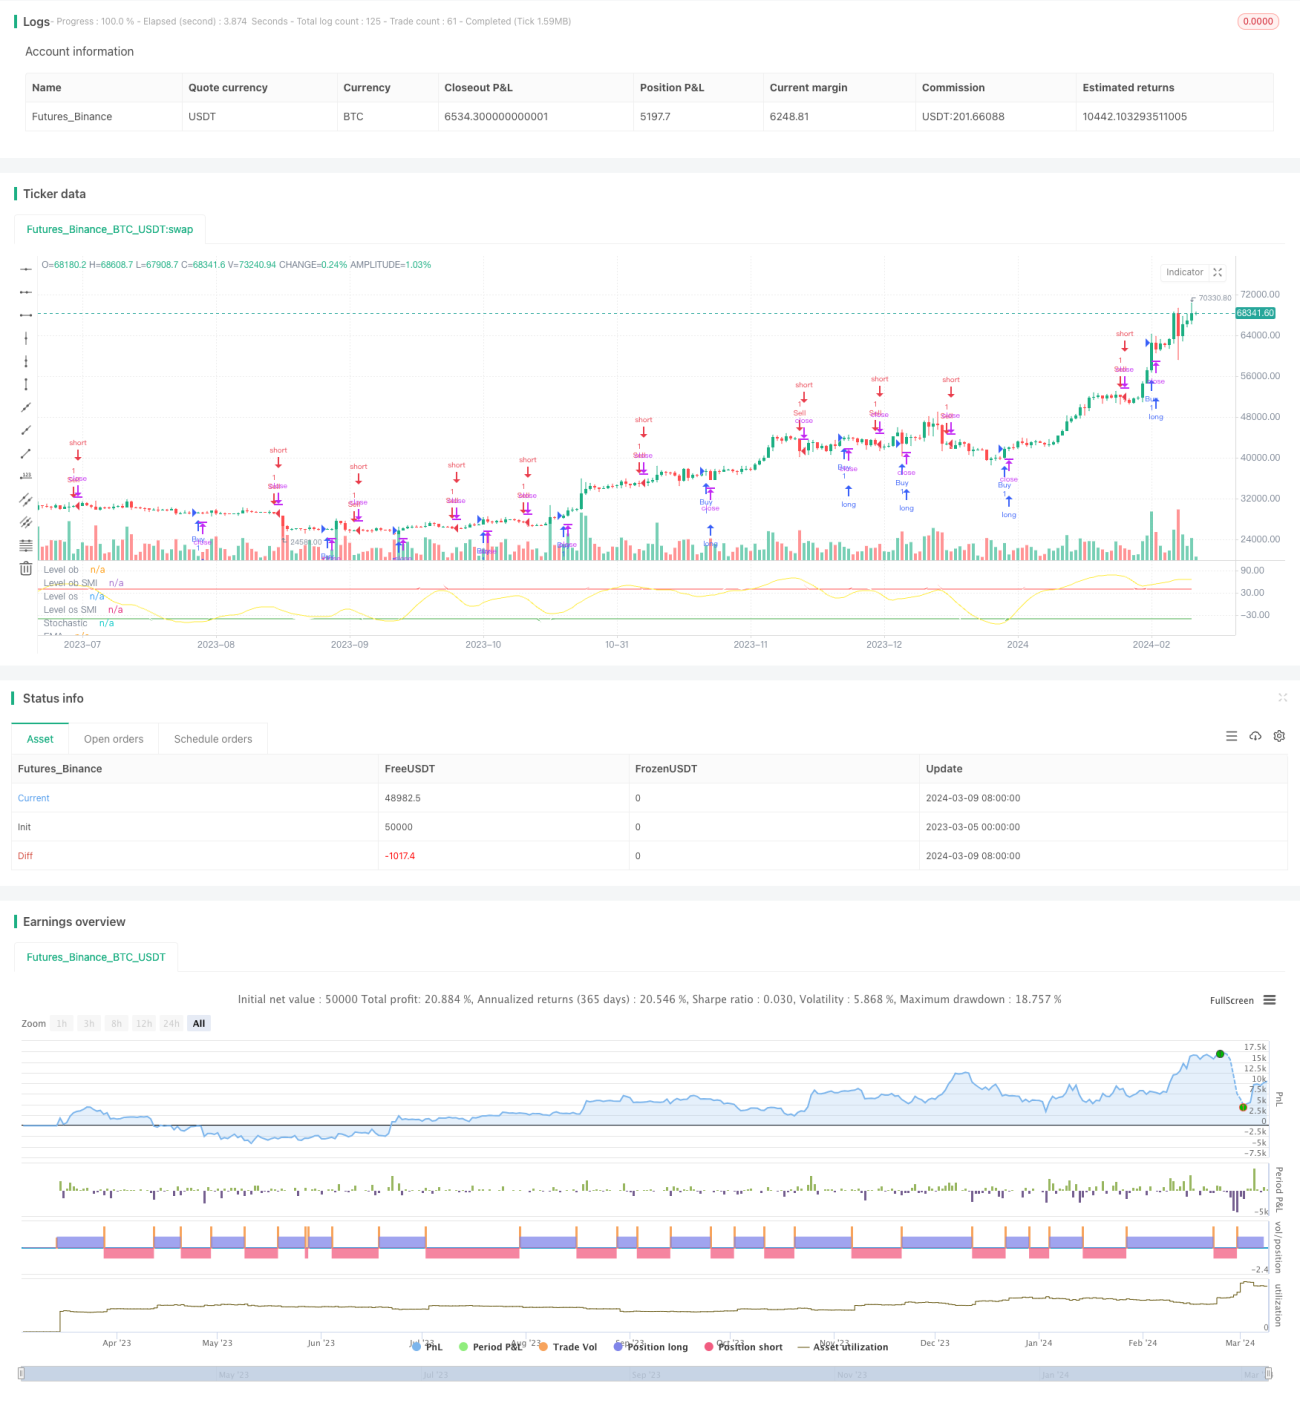
This article introduces a quantitative trading strategy based on the Stochastics Momentum Index (SMI). The strategy utilizes the crossover signals between the SMI indicator and its exponential moving average (EMA) to identify potential buying and selling opportunities. When the SMI signal line crosses above its EMA, it triggers a buy signal; when the SMI signal line crosses below its EMA, it triggers a sell signal.
Strategy Principle
The core of this strategy is the Stochastics Momentum Index (SMI). SMI is a momentum oscillator that measures the closing price relative to the high-low range over a specified period. Specifically, the strategy first calculates the highest high and lowest low over the specified period, then computes the difference between the closing price and the midpoint of the high-low range, as well as the difference between the highest high and lowest low. Next, the strategy calculates the SMI value, which is the ratio of the average relative difference to the average absolute difference multiplied by 100. Finally, the strategy calculates the exponential moving average of SMI as the signal line.
When the SMI signal line crosses above its EMA, it indicates increasing upward momentum and triggers a buy signal; when the SMI signal line crosses below its EMA, it indicates increasing downward momentum and triggers a sell signal. Additionally, the strategy marks the overbought and oversold levels to identify extreme states of SMI.
Strategy Advantages
-
The strategy is based on the powerful momentum indicator SMI, which can effectively capture changes in market trends and momentum.
-
The strategy logic is clear and easy to understand and implement.
-
By using the exponential moving average as the signal line, the strategy can smooth price noise and improve signal reliability.
-
The marking of overbought and oversold levels provides additional risk management tools for the strategy.
Strategy Risks
-
The strategy relies on a single indicator, SMI, and may face the risk of indicator failure. To mitigate this risk, one can consider combining other technical indicators or fundamental factors to confirm trading signals.
-
The strategy may generate frequent trading signals in choppy markets, leading to high transaction costs. To address this issue, one can reduce trading frequency by optimizing parameters or introducing filtering mechanisms.
-
The strategy lacks an explicit stop-loss mechanism and may face the problem of excessive single-trade risk. This can be addressed by setting appropriate stop-loss levels to control risk.
Strategy Optimization Directions
-
Parameter Optimization: The performance of the strategy largely depends on the parameters used in the SMI calculation, such as %K length, %D length, etc. By optimizing these parameters, the performance of the strategy can be improved.
-
Signal Filtering: To reduce trading frequency and improve signal quality, additional filtering mechanisms such as trend confirmation and volume confirmation can be considered.
-
Risk Management: Incorporating explicit stop-loss and position management rules into the strategy can better control risk and enhance the robustness of the strategy.
-
Multi-Factor Combination: Combining SMI signals with other technical indicators or fundamental factors to form a more comprehensive and reliable trading decision mechanism.
Summary
This article introduces a quantitative trading strategy based on the Stochastics Momentum Index (SMI). The strategy utilizes the crossover signals between the SMI indicator and its exponential moving average to identify potential buying and selling opportunities. The advantages of the strategy lie in its basis on a powerful momentum indicator, clear logic, ease of implementation, and the use of moving averages and overbought/oversold levels to improve signal reliability and risk management. However, the strategy also faces risks such as single indicator failure, high-frequency trading, and insufficient risk control. To further enhance the performance of the strategy, optimization can be made in terms of parameter optimization, signal filtering, risk management, and multi-factor combination. Overall, the strategy provides a simple yet effective approach for quantitative trading, but it requires appropriate adjustments and optimizations based on specific circumstances in practical applications.
- 1