G-Channel and EMA Trend-Following Strategy

Author: ChaoZhang, Date: 2024-03-11 11:08:06
Tags:

img

Overview

This article introduces a trend-following trading strategy based on the G-Channel indicator and the Exponential Moving Average (EMA). The strategy uses the G-Channel indicator to determine the current market trend direction and generates buy/sell signals based on crossovers with the EMA. The main idea is to buy when the price pulls back to the EMA during an uptrend and sell when the price rebounds to the EMA during a downtrend, thereby capturing the primary price trends.

Strategy Principles

The core of this strategy is the G-Channel indicator, first proposed by Andrew Guppy to identify the current trend direction of price movements. The G-Channel consists of an upper band, a lower band, and an average line. The upper band connects the highest price points of the recent period, the lower band connects the lowest price points, and the average line is the arithmetic mean of the upper and lower bands.

When the closing price breaks above the upper band, it signifies the start of an uptrend; when it breaks below the lower band, it signifies the start of a downtrend. The strategy uses the barssince() function to calculate how many bars ago the most recent upward and downward breakouts occurred. The direction that occurred more recently is considered the current trend direction.

The EMA is a trend-following indicator that places more weight on recent prices compared to a simple moving average, making it more responsive to price changes. In an uptrend, the EMA often acts as support below the price; in a downtrend, it often acts as resistance above the price.

The trading logic of this strategy is as follows:

  • When the G-Channel indicates a current uptrend and the closing price crosses below the EMA, a buy signal is generated. The price is likely to continue upward after a pullback.
  • When the G-Channel indicates a current downtrend and the closing price crosses above the EMA, a sell signal is generated. The price is likely to continue downward after a rebound.

Advantage Analysis

  1. Strong trend-following capability: The G-Channel indicator can acutely capture changes in price trends, avoiding misjudgments in sideways markets. Combined with a trend-following indicator like EMA, it further improves the accuracy of trend identification.
  2. High adaptability: The strategy can be well-adapted to any asset class and timeframe, whether stocks, futures, forex, or cryptocurrencies.
  3. Large room for parameter optimization: Parameters such as the observation period of G-Channel and the EMA settings can be flexibly adjusted according to different market characteristics and investor preferences for more targeted strategies.

Risk Analysis

  1. Trend reversal risk: The strategy may experience significant drawdowns in the early stages of a trend reversal. For example, the G-Channel may already indicate a trend reversal, but the EMA signal may lag, causing account losses.
  2. Parameter setting risk: Improper parameter settings can lead to deviations in trend judgment and incorrect trading signals. Strategy parameters need to be optimized based on backtesting and periodically reviewed.
  3. Black swan events: The strategy may fail in extreme market conditions. For example, if prices plunge rapidly and deviate from moving averages for an extended period due to a major bearish shock, the strategy may miss the best exit timing.

Optimization Directions

  1. Introduce more auxiliary indicators: In addition to EMA, combine with other trend indicators like Bollinger Bands and MACD to improve signal reliability.
  2. Optimize position management: Dynamically adjust positions based on trend strength and the price distance from moving averages to improve profitability while controlling risk.
  3. Incorporate market sentiment indicators: Integrate indicators reflecting market sentiment, such as the VIX panic index and Put/Call Ratio, to cut losses or take profits in a timely manner during extreme situations.

Summary

This article introduced a trend-following strategy based on the G-Channel and EMA indicators. The strategy uses G-Channel to accurately determine the current market trend direction and captures buying and selling opportunities based on price crossovers with EMA within the trend. The strategy’s advantages lie in its strong trend-following capability and wide adaptability, but one must also be wary of risks from trend reversals, improper parameter settings, and black swan events. In the future, the strategy’s robustness and profitability could be further enhanced by introducing more auxiliary indicators, optimizing position management, and incorporating market sentiment indicators. Overall, the strategy has a clear logic, simple and easy-to-understand principles, and is suitable for secondary development and live trading. It is worthy of reference and study by quantitative traders.


/*backtest
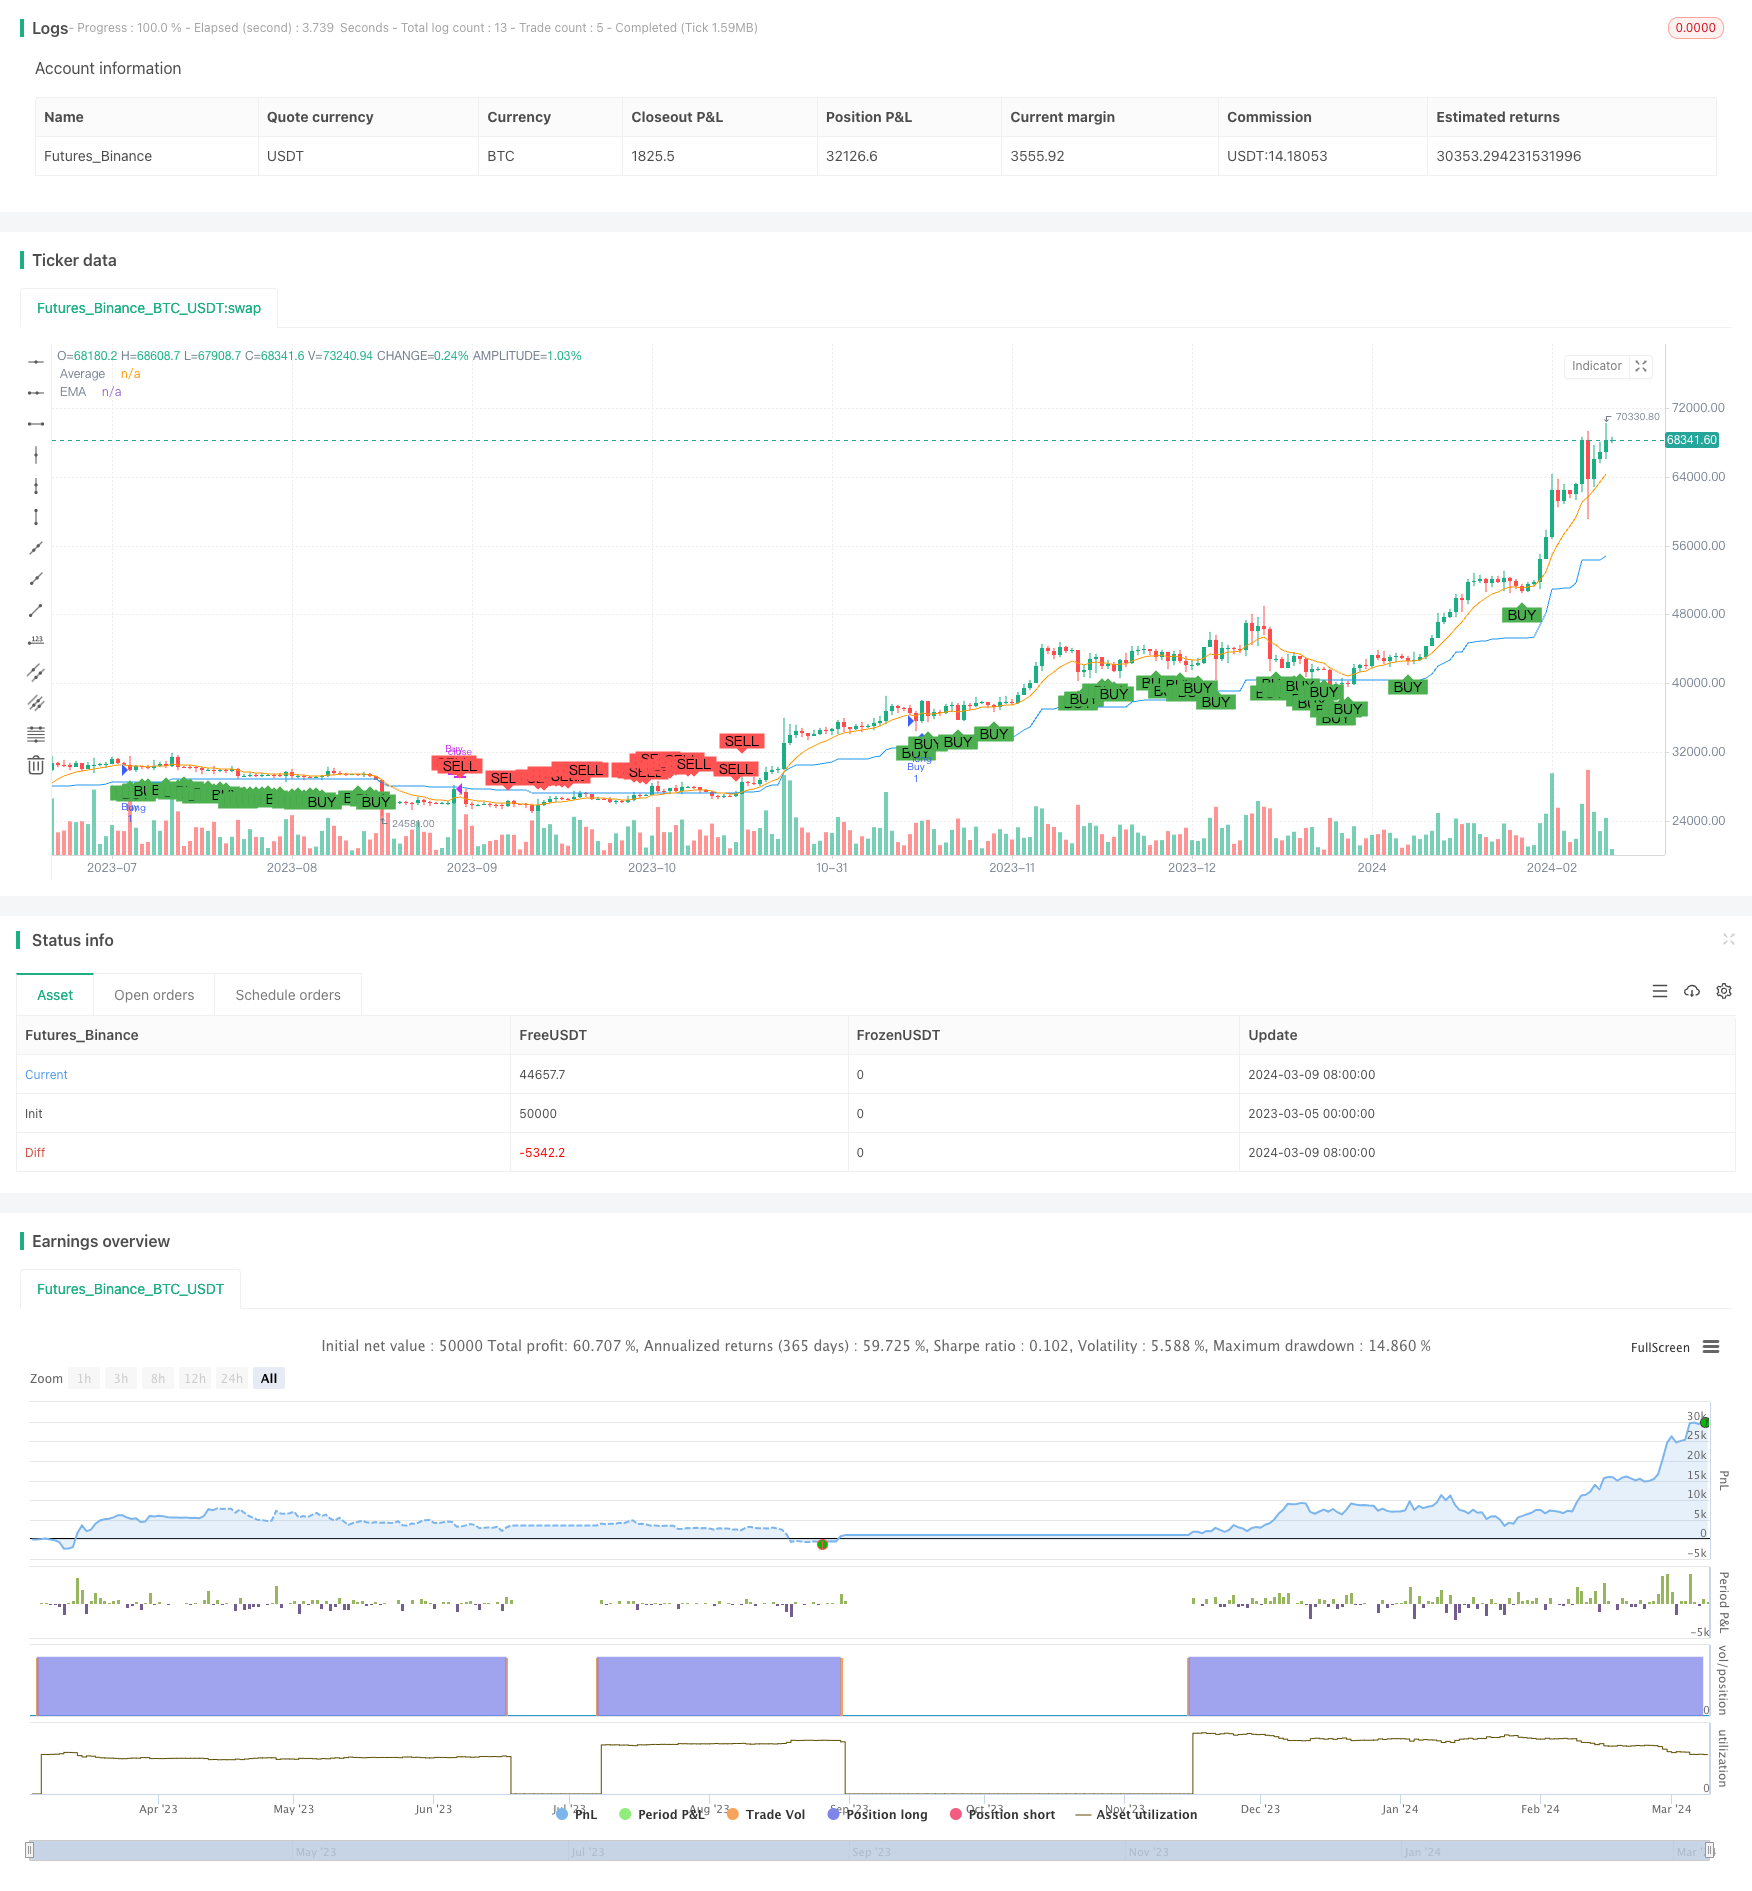
start: 2023-03-05 00:00:00
end: 2024-03-10 00:00:00
period: 1d
basePeriod: 1h
exchanges: [{"eid":"Futures_Binance","currency":"BTC_USDT"}]
*/

// This Pine Script™ code is subject to the terms of the Mozilla Public License 2.0 at https://mozilla.org/MPL/2.0/
// © jonathan_422

//@version=4
strategy("G-Channel and EMA Strategy", shorttitle="G-EMA Strategy", overlay=true)

// G-Channel settings
length = input(100)
src = input(close)

// Calculating G-Channel
a = 0.0
b = 0.0
a := max(src, nz(a[1])) - nz(a[1] - b[1]) / length
b := min(src, nz(b[1])) + nz(a[1] - b[1]) / length
avg = avg(a, b)

// EMA settings
emaLength = input(9, title="EMA Length")
ema = ema(close, emaLength)

// G-Channel buy/sell signals
crossup = b[1] < close[1] and b > close
crossdn = a[1] < close[1] and a > close
bullish = barssince(crossdn) <= barssince(crossup)

// Strategy logic
buySignal = bullish and close < ema
sellSignal = not bullish and close > ema

// Plotting
plot(ema, "EMA", color=color.orange)
plot(avg, "Average", color=color.blue)

// Plot buy/sell signals
plotshape(buySignal, title="Buy Signal", location=location.belowbar, color=color.green, style=shape.labelup, text="BUY")
plotshape(sellSignal, title="Sell Signal", location=location.abovebar, color=color.red, style=shape.labeldown, text="SELL")

// Strategy execution
strategy.entry("Buy", strategy.long, when=buySignal)
strategy.close("Buy", when=sellSignal)


More