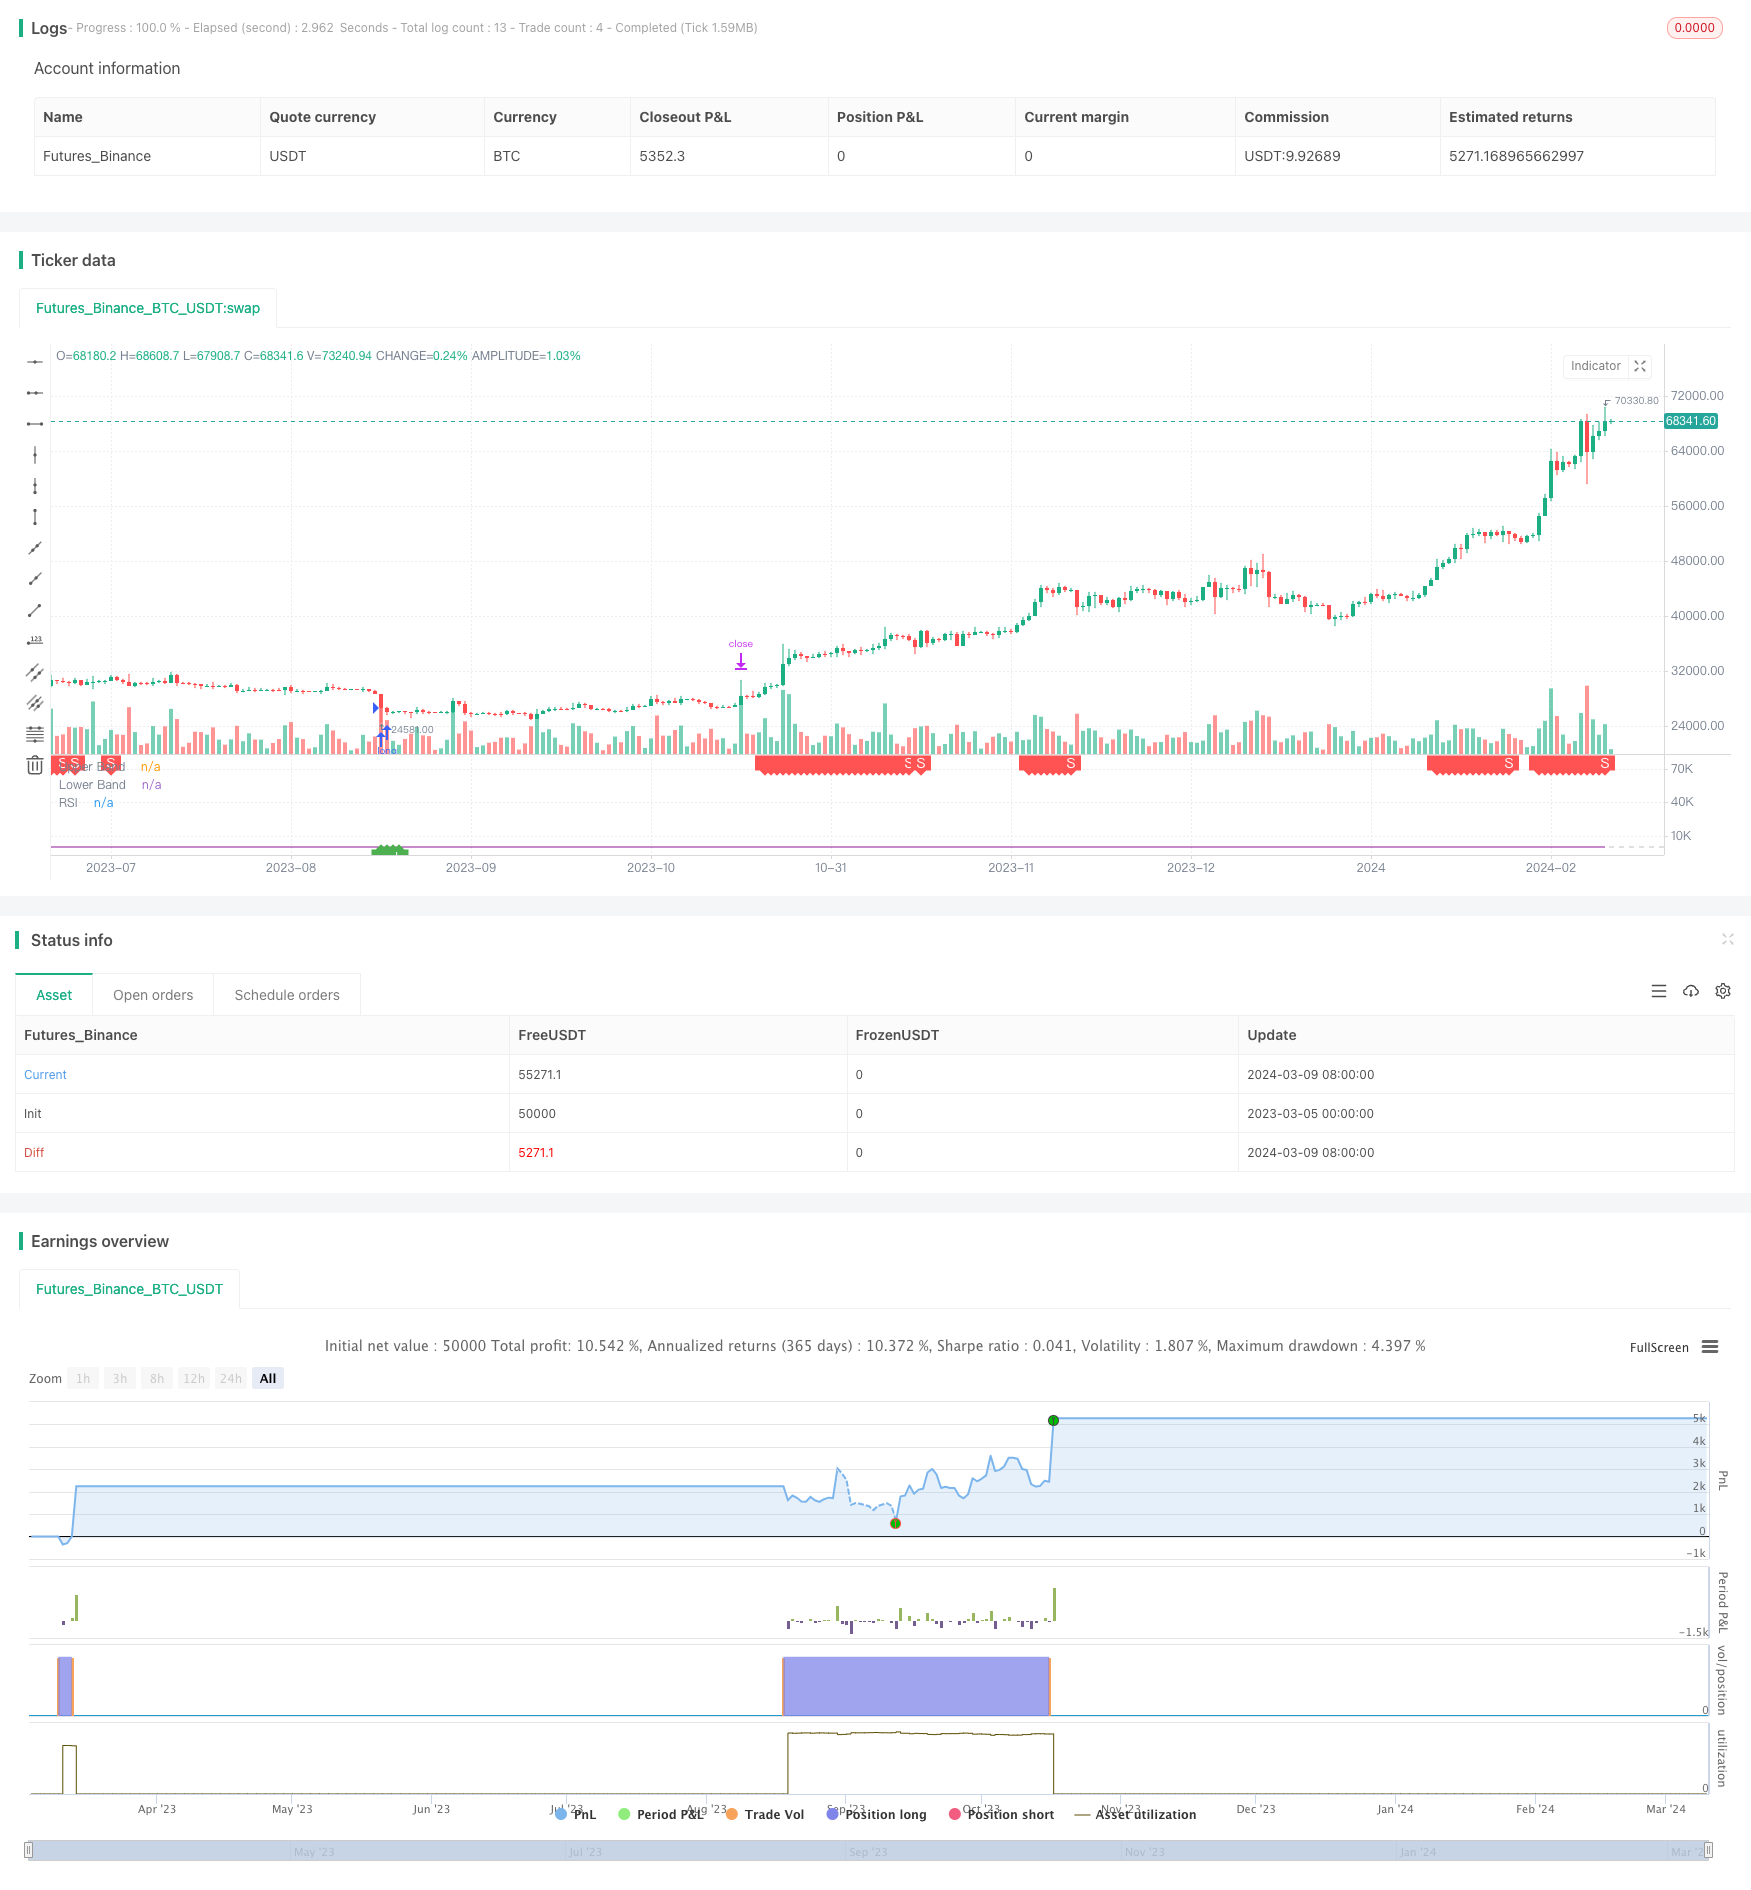
Bullish Swing Trading Strategy Based on Bollinger Bands and RSI

Author: ChaoZhang, Date: 2024-03-11 11:51:22
Tags:

img

Overview

This strategy utilizes two technical indicators, Bollinger Bands and Relative Strength Index (RSI), for bullish swing trading in uptrends. The strategy logic is simple yet effective: open a long position when the price breaks below the lower Bollinger Band and RSI is below 35, and close the position when RSI crosses above 69. Take profit and stop loss levels are also set.

Strategy Principles

  1. Calculate RSI: Use Relative Moving Average (RMA) to calculate the average magnitude of price increases and decreases separately, then divide the magnitude of increases by the total magnitude to obtain RSI. RSI reflects the strength of price movements over a period of time.

  2. Calculate Bollinger Bands: Use Simple Moving Average (SMA) to calculate the price midline, then add and subtract standard deviations to get the upper and lower bands. Bollinger Bands can dynamically reflect the range of price fluctuations.

  3. Open long: When the price breaks below the lower Bollinger Band and RSI is less than 35, it is considered oversold, and a long position is opened. These two conditions can capture the timing of an upward reversal.

  4. Close long: When RSI crosses above 69, it is considered overbought, and the long position is closed to lock in profits.

  5. Take profit and stop loss: After opening a position, the take profit and stop loss prices are calculated based on user-defined percentages. The position is closed when either the take profit or stop loss price is reached. This helps control the risk and return of each trade.

Advantage Analysis

  1. Bollinger Bands can objectively reflect the range of price movements and adjust in sync with price trends without being limited by fixed thresholds.

  2. RSI can intuitively reflect the balance between bullish and bearish forces and is also relatively objective. It is often used to determine overbought and oversold conditions.

  3. When used in uptrends, it is more suitable for swing trading. By capturing price rebounds with the lower Bollinger Band and low RSI, and timely closing positions with high RSI, it can effectively capture short-term market movements.

  4. The setting of take profit and stop loss makes the strategy’s risk controllable. Investors can flexibly set parameters according to their risk preferences.

  5. The strategy logic and code are relatively simple, easy to understand and implement, and the backtest results are relatively stable.

Risk Analysis

  1. In choppy markets, Bollinger Bands and RSI may generate too many trading signals, leading to high trading frequency and increased transaction costs.

  2. A single indicator like RSI is easily affected by short-term price fluctuations and may produce misleading signals. Therefore, RSI signals are best analyzed in conjunction with price trends.

  3. The selection of Bollinger Band and RSI parameters has a significant impact on strategy performance, and different markets and instruments may require different parameters. Users need to make appropriate adjustments based on specific situations.

  4. In the event of unexpected events or abnormal market conditions, Bollinger Bands and RSI may become ineffective. If there are no other risk control measures in place, it may bring significant drawdowns to the strategy.

Optimization Directions

  1. Consider introducing other technical indicators such as moving averages for filtering. For example, only open positions when the moving averages are in a bullish alignment to improve the reliability of signals.

  2. Optimize the upper and lower thresholds of RSI, the parameters of Bollinger Bands, etc., to find the best performing parameter combinations for each instrument and time frame.

  3. Based on backtesting, conduct forward testing and proper simulated trading to fully validate the effectiveness and stability of the strategy before live trading.

  4. Further control strategy drawdowns and improve risk-adjusted returns through position sizing, dynamic take profit and stop loss, and other methods.

  5. Incorporate the strategy into an investment portfolio and use it in conjunction with other strategies for hedging, rather than using it in isolation, to improve portfolio stability.

Summary

This article introduces a bullish swing trading strategy based on two technical indicators, Bollinger Bands and RSI. The strategy is suitable for capturing short-term market movements in uptrends, and its logic and implementation are relatively simple. It opens long positions when the price breaks below the lower Bollinger Band and RSI is low, closes positions when RSI is high, and sets take profit and stop loss levels. The strategy’s advantages are that it can objectively reflect the range of price fluctuations and the balance of bullish and bearish forces, and its risks are relatively controllable. However, when using it in practice, one needs to pay attention to controlling trading frequency, combining more indicators to filter signals, optimizing parameters, and managing positions. In addition, the strategy may fail in abnormal market conditions and requires other risk control measures as a supplement. By introducing other filtering indicators, dynamic take profit and stop loss, money management, portfolio allocation, and other methods, the stability and profitability of the strategy can be further improved. Overall, the strategy can serve as a useful complement for trend investors, but should be used prudently according to one’s own characteristics.


/*backtest
start: 2023-03-05 00:00:00
end: 2024-03-10 00:00:00
period: 1d
basePeriod: 1h
exchanges: [{"eid":"Futures_Binance","currency":"BTC_USDT"}]
*/

//@version=4
strategy(title="Bollinger Band with RSI", shorttitle="BB&RSI")
len = input(14, minval=1, title="Length")
src = input(close, "Source", type = input.source)
up = rma(max(change(src), 0), len)
down = rma(-min(change(src), 0), len)
rsi = down == 0 ? 100 : up == 0 ? 0 : 100 - (100 / (1 + up / down))
plot(rsi, "RSI", color=#8E1599)
band1 = hline(69, "Upper Band", color=#C0C0C0)
band0 = hline(31, "Lower Band", color=#C0C0C0)
fill(band1, band0, color=#9915FF, transp=90, title="Background")

length_bb = input(20,title="BB Length", minval=1)
mult = input(2.0, minval=0.001, maxval=50, title="BB StdDev")
basis = sma(src, length_bb)
dev = mult * stdev(src, length_bb)
upper = basis + dev
lower = basis - dev
offset = input(0, "BB Offset", type = input.integer, minval = -500, maxval = 500)


Plot_PnL = input(title="Plot Cummulative PnL", type=input.bool, defval=false)
Plot_Pos = input(title="Plot Current Position Size", type=input.bool, defval=false)

long_tp_inp = input(10, title='Long Take Profit %', step=0.1)/100
long_sl_inp = input(25, title='Long Stop Loss %', step=0.1)/100
// Take profit/stop loss
long_take_level = strategy.position_avg_price * (1 + long_tp_inp)
long_stop_level = strategy.position_avg_price * (1 - long_sl_inp)

entry_long = rsi < 35.58 and src < lower
exit_long = rsi > 69
 
plotshape(entry_long, style=shape.labelup, color=color.green,  location=location.bottom, text="L", textcolor=color.white, title="LONG_ORDER")
plotshape(exit_long, style=shape.labeldown, color=color.red,  location=location.top, text="S", textcolor=color.white, title="SHORT_ORDER")

strategy.entry("Long",true,when=entry_long)    
strategy.exit("TP/SL","Long", limit=long_take_level, stop=long_stop_level)
strategy.close("Long", when=exit_long, comment="Exit")
plot(Plot_PnL ? strategy.equity-strategy.initial_capital : na, title="PnL", color=color.red)
plot(Plot_Pos ? strategy.position_size : na, title="open_position", color=color.fuchsia)


More