The RSI Crossover Trading Strategy

Author: ChaoZhang, Date: 2024-03-11 16:05:04
Tags:

img

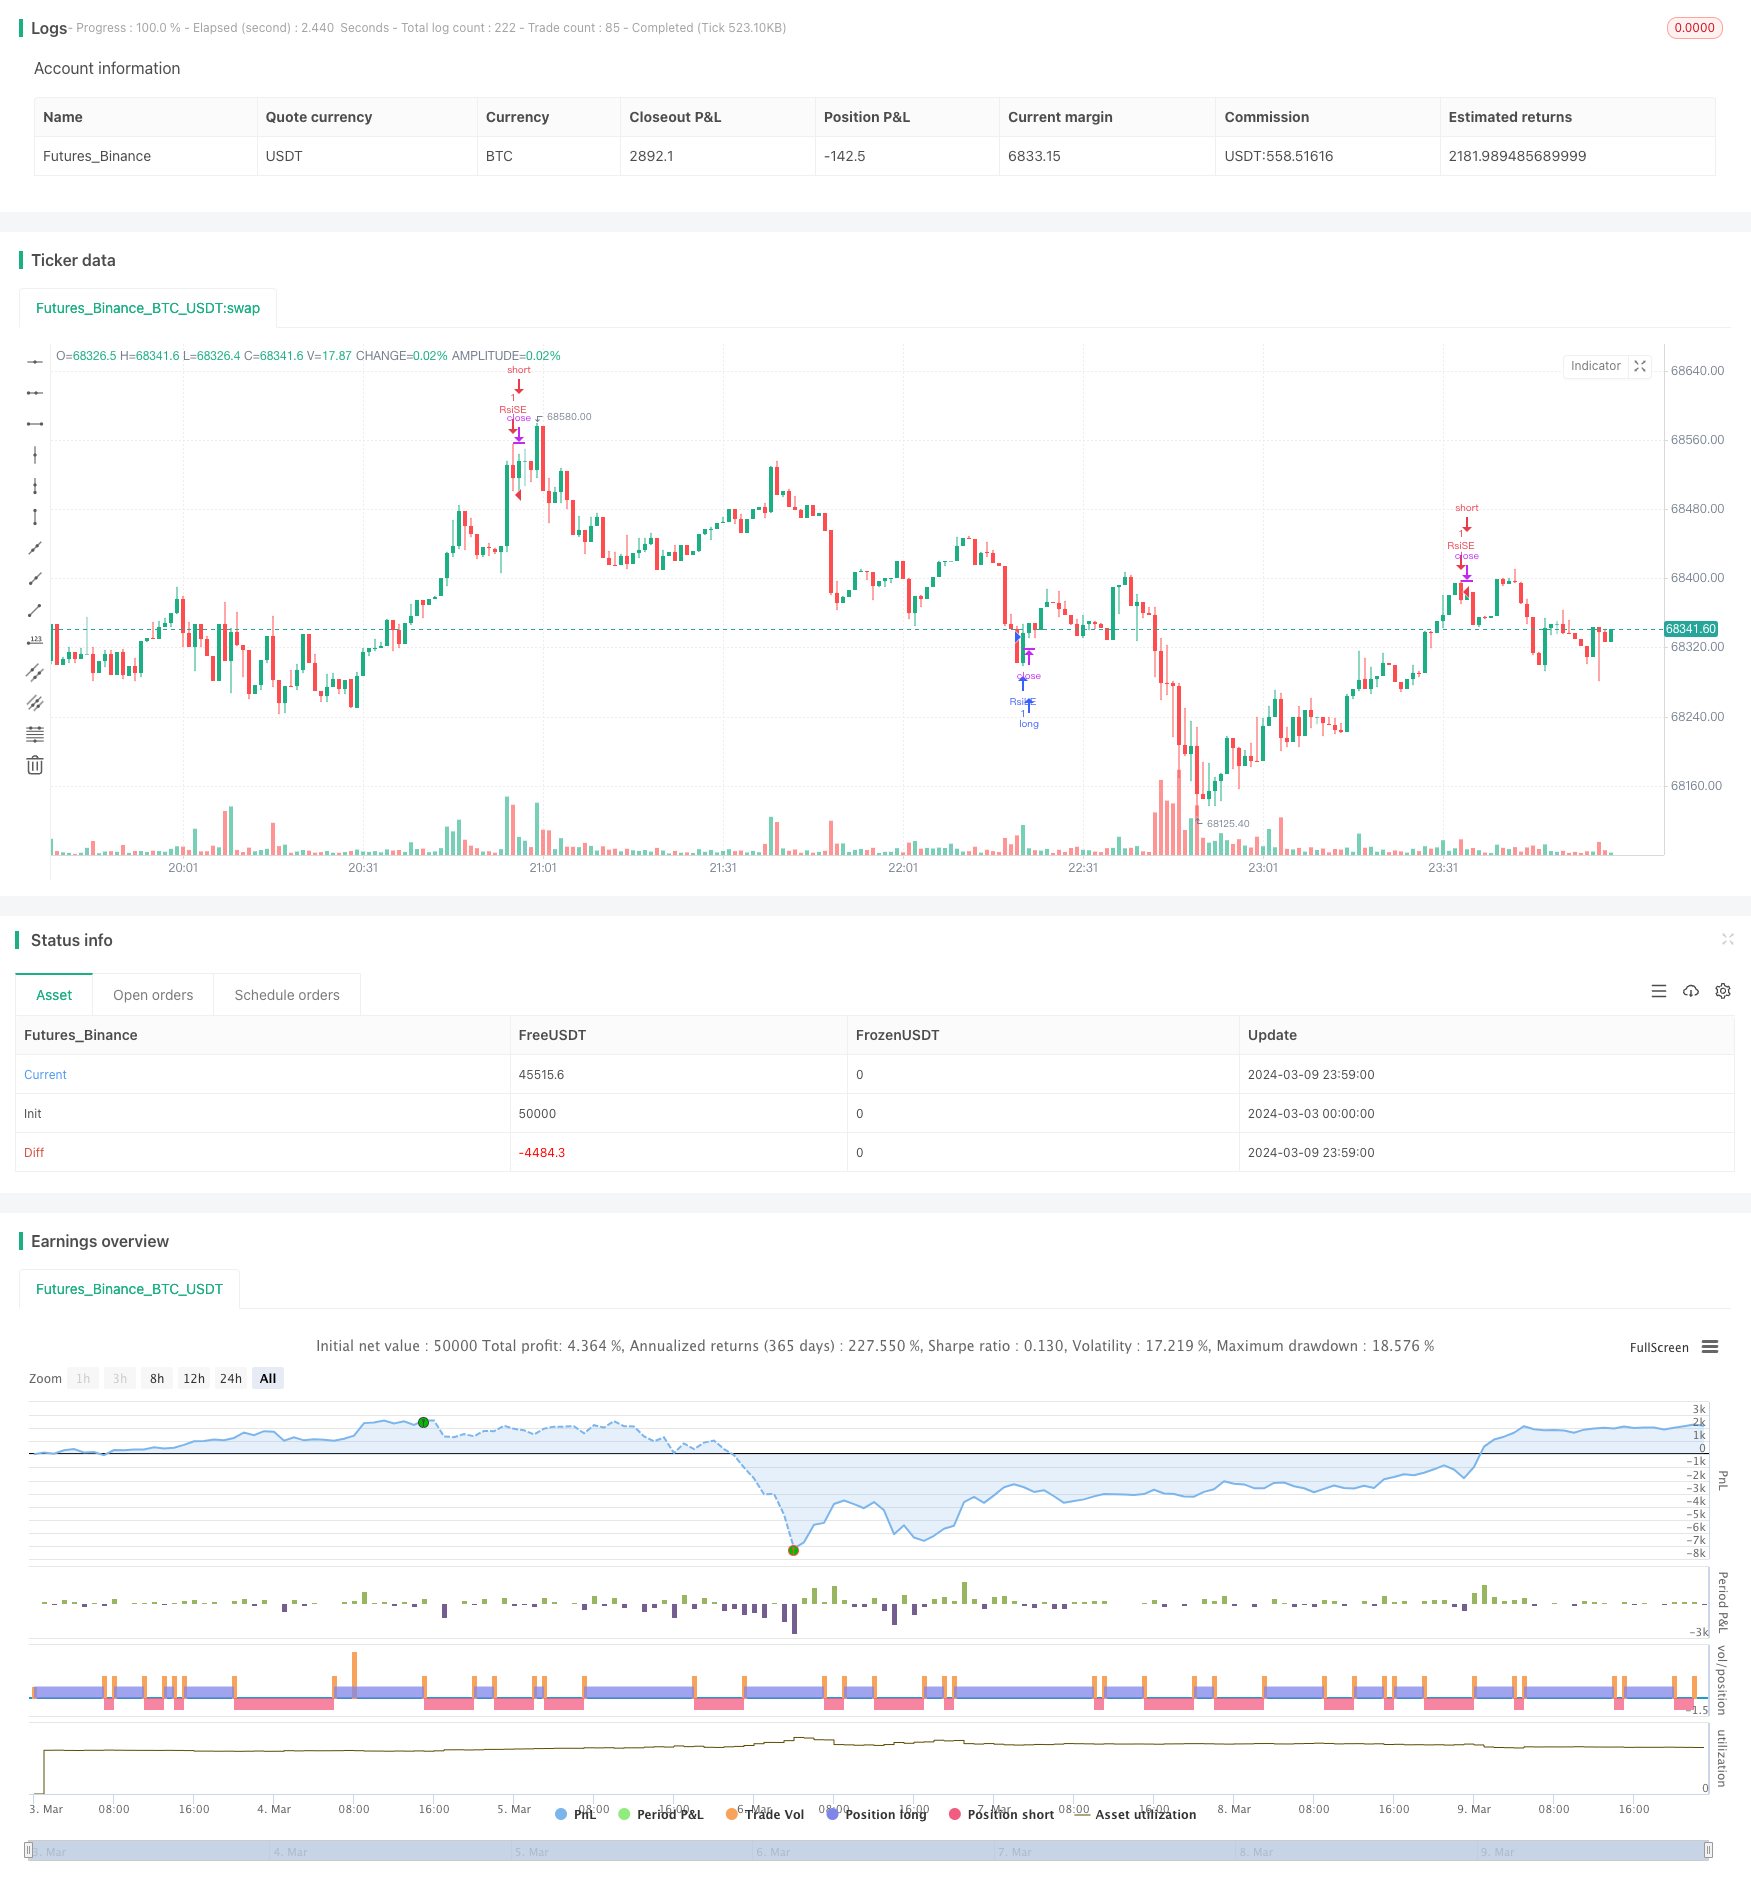
Strategy Overview: The RSI Crossover Trading Strategy is a quantitative trading strategy based on the Relative Strength Index (RSI) indicator. It utilizes the crossover signals of the RSI to identify overbought and oversold market conditions, and makes trades at appropriate timings. When the RSI crosses above the oversold level from below, it opens a long position; when the RSI crosses below the overbought level from above, it opens a short position. The strategy also sets exit conditions: when the RSI of a long position crosses below the overbought level from above or the RSI of a short position crosses above the oversold level from below, it closes the position.

Strategy Principle: RSI is a momentum oscillator that measures the speed and change of price movements by comparing the magnitude of recent gains to recent losses over a specified time period. The RSI ranges from 0 to 100. When the RSI is above 70, it is commonly considered that the market is overbought and may face selling pressure; when the RSI is below 30, the market is thought to be oversold and may have a chance to rebound.

The core of this strategy is to use the crossover signals of RSI above and below the overbought and oversold levels to make trading decisions. Specifically:

  1. Calculate the RSI value for a specified period (default is 19)
  2. Set the oversold and overbought levels (default is 35 and 70 respectively)
  3. Determine if the RSI has crossed above the oversold level from below, if so, open a long position
  4. Determine if the RSI has crossed below the overbought level from above, if so, open a short position
  5. For the holding long position, determine if the RSI has crossed below the overbought level from above, if so, close the long position
  6. For the holding short position, determine if the RSI has crossed above the oversold level from below, if so, close the short position

Through these simple judgment conditions and trading rules, the strategy can capture the overbought and oversold conditions of the market quite well, and enter or exit positions timely when the price may reverse.

Strategy Advantages:

  1. Simple logic, easy to understand and implement. The strategy relies solely on the RSI indicator, with clear and straightforward judgment conditions, suitable for novice quantitative traders to learn and use.
  2. No need to predict market trends, only do certain things. The RSI crossover trading strategy does not care whether the price will continue to rise or fall, but only trades at key overbought and oversold moments. This can avoid the interference of market noise to a certain extent.
  3. Wide range of applications. The RSI indicator can be used in various markets and varieties, such as stocks, futures, foreign exchange, etc. Different market characteristics may require parameter adjustments, but the overall trading logic is common.

Strategy Risks:

  1. Parameter sensitivity. The calculation period of the RSI indicator and the setting of overbought and oversold thresholds have a great impact on the strategy effect. Different parameters may lead to completely different results. Therefore, parameter optimization is required based on the characteristics of the target and market environment in practical applications.
  2. Poor performance in trending markets. The RSI crossover strategy often performs better in volatile markets, but in strong trending markets, frequent false signals may occur, leading to consecutive losses. Inadequate market analysis and stubbornness can also bring risks.
  3. Lack of necessary risk control measures. The simple RSI crossover strategy does not consider position management, stop-loss and stop-profit and other risk control means. In highly volatile markets, this may lead to large drawdowns or even liquidation.

Optimization Direction:

  1. Adaptive parameter optimization. For different varieties and market stages, adopt an adaptive method to dynamically adjust the period and threshold of the RSI indicator to achieve better results.
  2. Trend filtering. While using RSI crossover signals, introduce other auxiliary indicators to judge the trend direction of the larger timeframe, and only enter the market when the trend is consistent with the signal to avoid going against the trend.
  3. Position management and risk control. Control the position size of each transaction according to factors such as market volatility and personal risk preference. At the same time, set reasonable stop-loss and stop-profit conditions to prevent excessive losses from a single transaction.
  4. Portfolio optimization. Combine the RSI crossover strategy with other different types of strategies to give play to their respective advantages and improve the overall robustness and profitability.

Summary: The RSI Crossover Trading Strategy is a simple and practical quantitative trading strategy that makes trading decisions by capturing overbought and oversold market conditions. It has clear logic, wide applicability, but also has problems such as parameter sensitivity, poor performance in trending markets, and insufficient risk control measures. In practical applications, we can start from adaptive parameter optimization, trend filtering, position management and risk control, strategy combination and other aspects to continuously improve and enhance the robustness and profitability of the strategy. The core of quantitative trading lies in using programs to execute existing mature trading strategies, and excellent trading strategies require investors to continuously summarize, optimize, and innovate in practice. The RSI Crossover Trading Strategy can serve as a good starting point to help us understand the basic ideas and methods of quantitative trading, but more importantly, we need to learn to use it flexibly and develop more complex, intelligent strategy systems that adapt to market changes to truly become profitable quantitative investors.


/*backtest
start: 2024-03-03 00:00:00
end: 2024-03-10 00:00:00
period: 1m
basePeriod: 1m
exchanges: [{"eid":"Futures_Binance","currency":"BTC_USDT"}]
*/

//@version=5
strategy("RSI Strategy", overlay=true)

length = input(19)
overSold = input(35)
overBought = input(70)
price = close

vrsi = ta.rsi(price, length)
co = ta.crossover(vrsi, overSold)
cu = ta.crossunder(vrsi, overBought)

if (not na(vrsi))
    if (co)
        strategy.entry("RsiLE", strategy.long, comment="RsiLE")
    if (cu)
        strategy.entry("RsiSE", strategy.short, comment="RsiSE")

// Define exit conditions
exitLong = ta.crossunder(vrsi, overBought)
exitShort = ta.crossover(vrsi, overSold)

// Exit trades based on exit conditions
if exitLong
    strategy.close("RsiLE")
    label.new(x = bar_index, y = low, text = "E", color = color.green, textcolor = color.white, style = label.style_label_down)
if exitShort
    strategy.close("RsiSE")
    label.new(x = bar_index, y = high, text = "E", color = color.red, textcolor = color.white, style = label.style_label_up)


More