Dynamic RSI and Dual Moving Average Buy/Sell Strategy

Strategy Overview
The Dynamic RSI and Dual Moving Average Buy/Sell Strategy is a quantitative trading strategy that combines the Relative Strength Index (RSI), Simple Moving Average (SMA), and Exponential Moving Average (EMA). The strategy aims to capture potential buy and sell signals to profit in the market. By analyzing the relationships between RSI, SMA, and EMA, the strategy triggers buy and sell operations based on predefined conditions. Additionally, the strategy incorporates risk management measures such as take profit, stop loss, and trailing stop loss to control potential losses and protect gained profits.
Strategy Principles
The core principle of this strategy is to utilize the relationships among RSI, SMA, and EMA to determine market trends and timing for buying and selling. Specifically:
-
When the 2-period RSI is less than or equal to 20, the current closing price is greater than or equal to the 200-period SMA, and the current closing price is greater than or equal to the 20-period EMA, a buy signal is triggered. This indicates that the market may be in an oversold state, and the current price is above the long-term and mid-term moving averages, suggesting a potentially good buying opportunity.
-
When the 80-period EMA appears and the 2-period RSI is greater than or equal to 80, a sell signal is triggered. This suggests that the market may be in an overbought state, and the current price is below the long-term moving average, indicating a potentially good selling opportunity.
-
When the 2-period RSI is greater than or equal to 80, the current closing price is less than or equal to the 200-period SMA, and the current closing price is less than or equal to the 80-period EMA, a short selling signal is triggered. This indicates that the market may be in an overbought state, and the current price is below the long-term and mid-term moving averages, suggesting a potentially good opportunity for short selling.
-
When the lowest price is less than or equal to the 20-period EMA and the 2-period RSI is less than or equal to 10, a signal to close the short position is triggered. This suggests that the market may be about to reverse upward, and therefore, the short position should be closed to avoid risk.
In addition to buy and sell signals, the strategy incorporates risk management measures such as take profit, stop loss, and trailing stop loss. Users can set corresponding take profit, stop loss, and trailing stop loss levels according to their risk preferences. This helps control potential losses and protect gained profits.
Strategy Advantages
-
Combination of multiple technical indicators: The strategy comprehensively considers three commonly used technical indicators: RSI, SMA, and EMA. It analyzes market trends and timing for buying and selling from multiple perspectives, enhancing the reliability of the strategy.
-
Introduction of risk management measures: By setting take profit, stop loss, and trailing stop loss levels, the strategy effectively controls potential losses and protects gained profits, strengthening the risk management capability of the strategy.
-
Adjustable parameters: Users can adjust various parameters in the strategy, such as RSI period, SMA and EMA periods, take profit and stop loss levels, according to their preferences and market characteristics, to adapt to different trading styles and market environments.
-
Wide applicability: The strategy can be applied to various financial markets, such as stocks, futures, and forex, demonstrating strong versatility and applicability.
Strategy Risks
-
Parameter setting risk: Improper parameter settings may lead to a decline in strategy performance or even significant losses. Therefore, when using this strategy, it is necessary to carefully evaluate and optimize parameters to ensure the robustness of the strategy.
-
Market risk: The strategy is based on historical data and specific technical indicators. When significant changes occur in the market or black swan events emerge, the strategy may not be able to adapt in a timely manner, resulting in losses. Therefore, it is necessary to closely monitor market dynamics and make adjustments to the strategy when necessary.
-
Overfitting risk: If the strategy parameters are too complex or optimized for specific historical data, it may lead to overfitting, resulting in poor performance in actual application. Therefore, when developing and optimizing the strategy, it is important to control the overfitting risk.
Strategy Optimization
-
Dynamic parameter adjustment: Based on market changes and strategy performance, dynamically adjust strategy parameters, such as RSI period, SMA and EMA periods, take profit and stop loss levels, to adapt to different market environments and improve the robustness of the strategy.
-
Introduction of other technical indicators: Consider introducing other effective technical indicators, such as Bollinger Bands, MACD, etc., to enrich the analysis dimensions of the strategy and improve the reliability of buy and sell signals.
-
Combination with fundamental analysis: Combine fundamental analysis with technical analysis. When determining the timing for buying and selling, consider fundamental factors such as macroeconomics, industry trends, and company performance to improve the comprehensiveness and accuracy of the strategy.
-
Enhanced risk management: Optimize risk management measures, such as introducing multi-level stop loss, dynamic stop loss, risk parity, etc., to better control risks and protect capital safety.
-
Backtesting and live trading optimization: Regularly conduct strategy backtesting and live trading, analyze the performance of the strategy under different market conditions, promptly identify and resolve potential issues, and continuously optimize and refine the strategy.
Summary
The Dynamic RSI and Dual Moving Average Buy/Sell Strategy is a quantitative trading strategy that combines technical indicators such as RSI, SMA, and EMA. The strategy analyzes the relationships among indicators and triggers buy and sell operations based on predefined conditions while incorporating risk management measures such as take profit, stop loss, and trailing stop loss. The advantages of the strategy include considering multiple technical indicators, introducing risk management measures, adjustable parameters, wide applicability, etc. However, in actual application, it is necessary to pay attention to potential risks such as parameter setting risk, market risk, and overfitting risk. To further improve the performance and robustness of the strategy, optimization measures such as dynamic parameter adjustment, introduction of other technical indicators, combination with fundamental analysis, enhanced risk management, etc., can be considered. Additionally, regularly conducting backtesting and live trading analysis, continuously optimizing and refining the strategy, is also an important method to ensure the long-term effectiveness of the strategy.
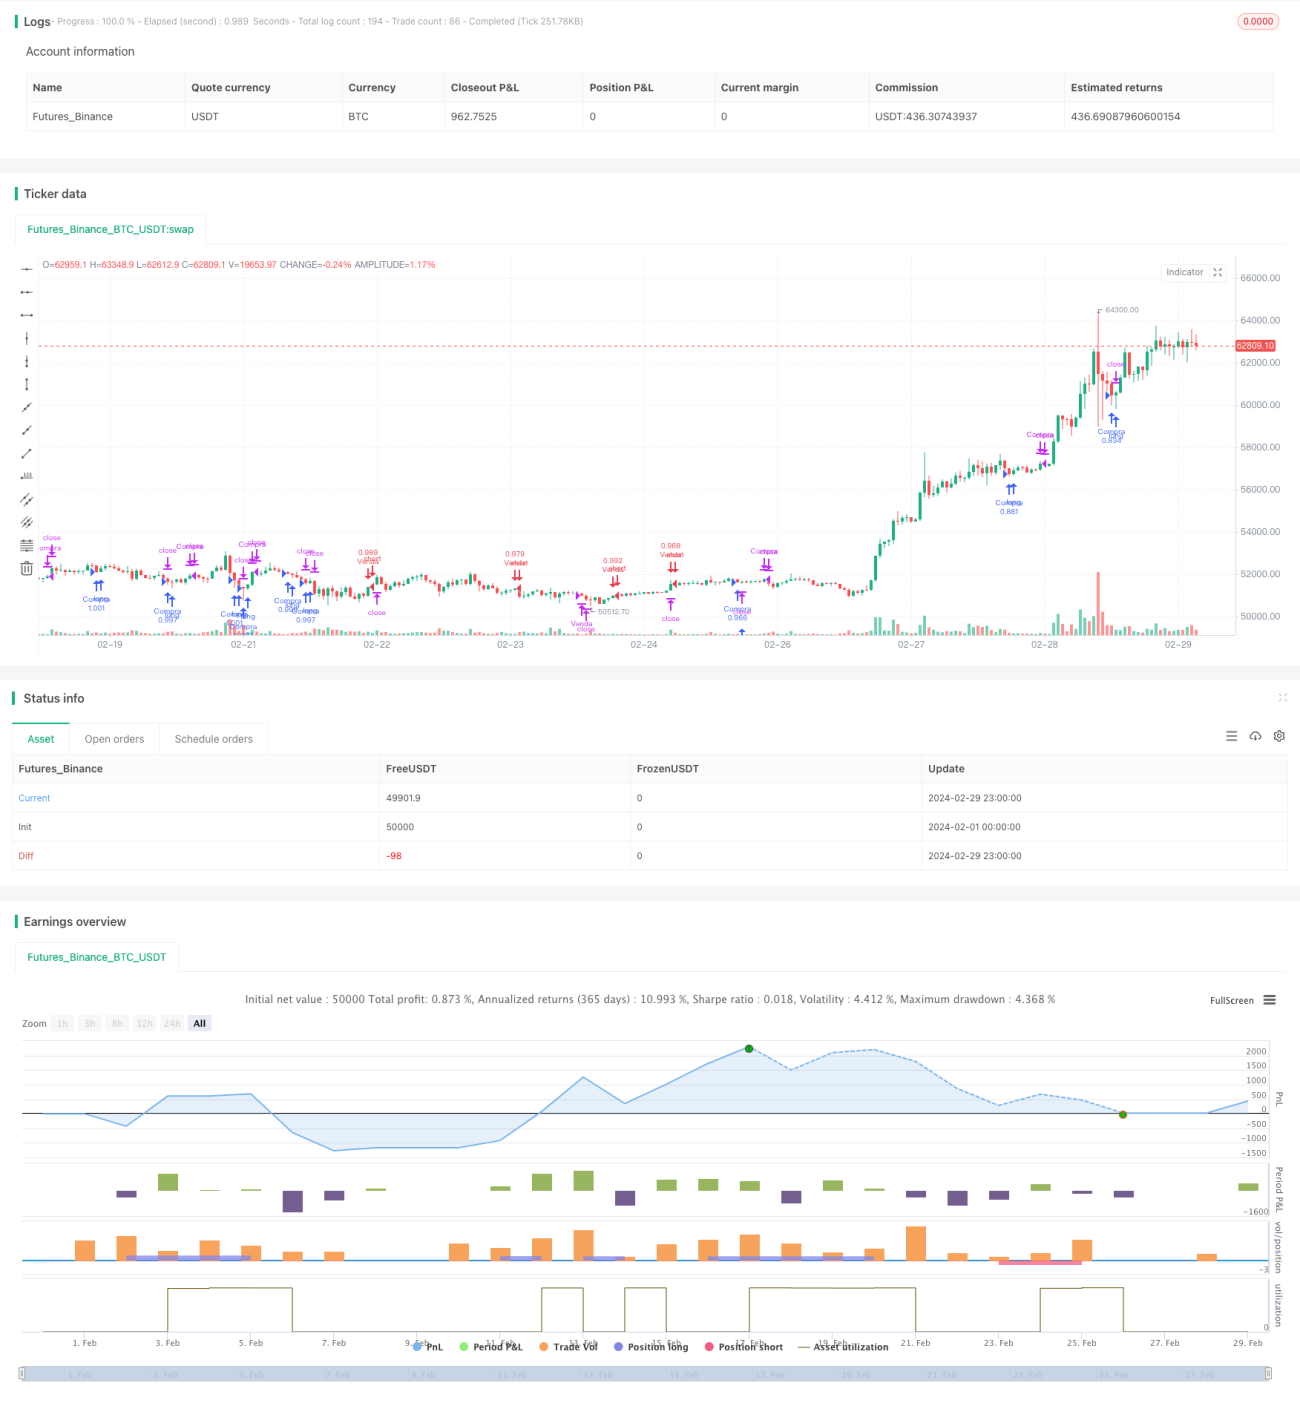
/*backtest
start: 2024-02-01 00:00:00
end: 2024-02-29 23:59:59
period: 1h
basePeriod: 15m
exchanges: [{"eid":"Futures_Binance","currency":"BTC_USDT"}]
*/

//@version=5
strategy("ag7 buy sell", overlay=true, default_qty_type = strategy.percent_of_equity, default_qty_value = 100)

inpTakeProfit = input.int(defval = 100000000, title = "Take Profit", minval = 0)- 1