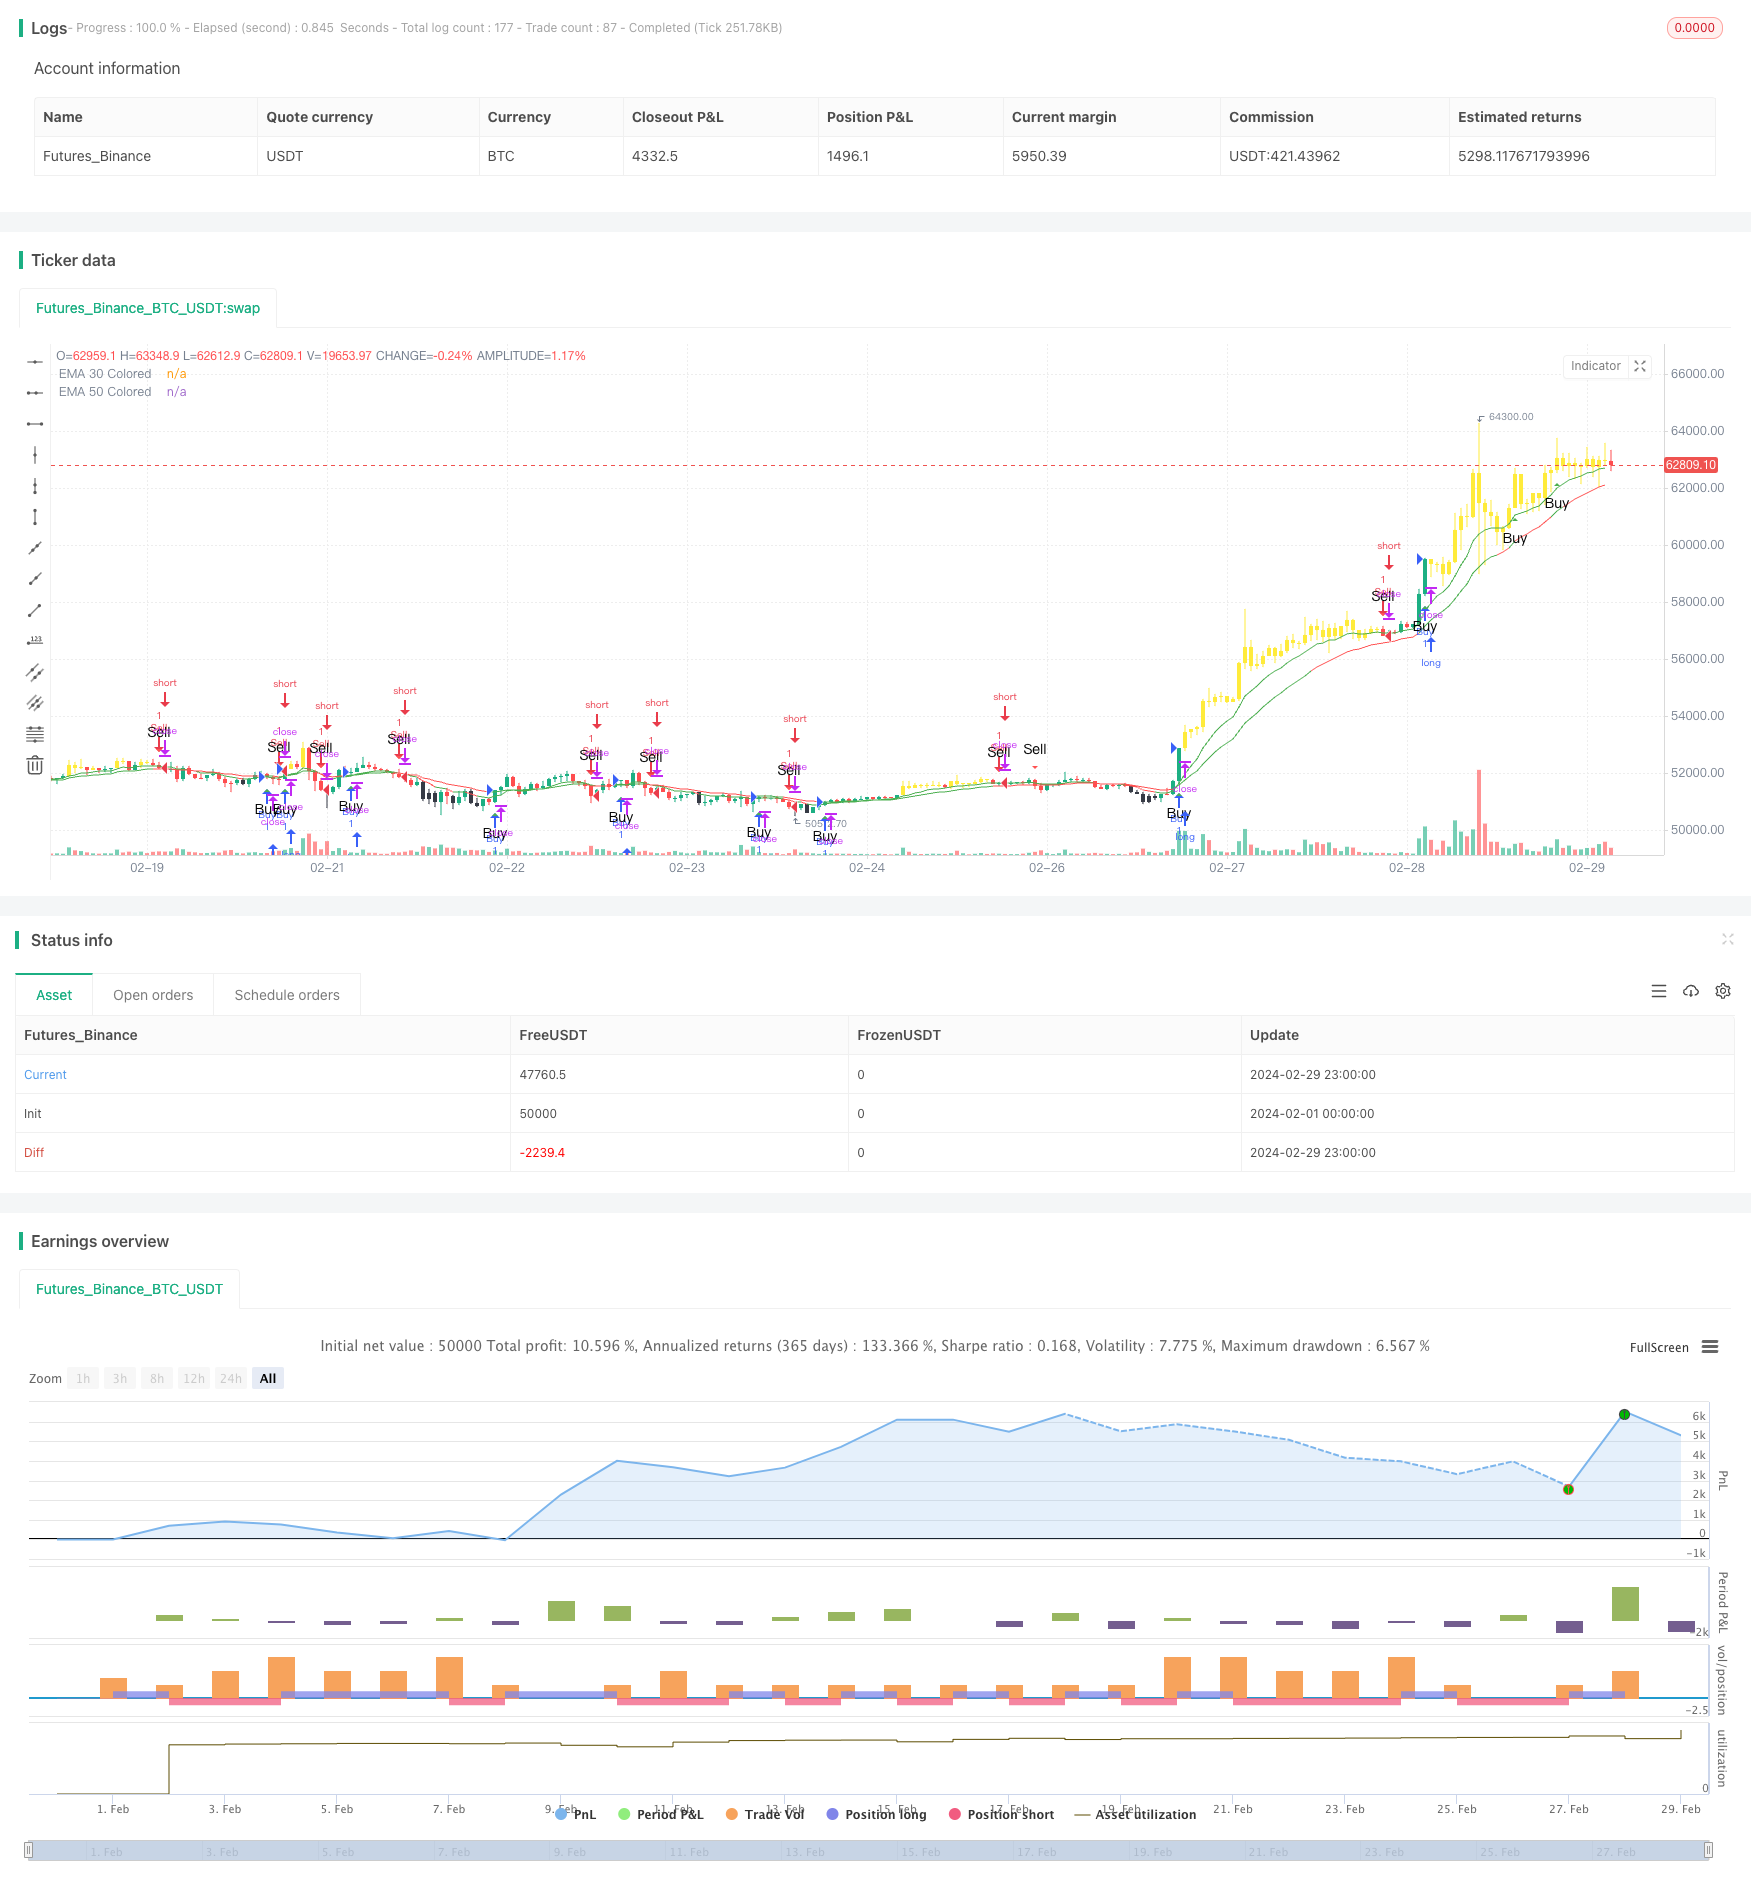
策略概述
RSI和MACD交叉策略是一个基于相对强弱指数(RSI)和移动平均线收敛发散指标(MACD)的交易策略。该策略利用RSI和MACD的交叉信号来识别潜在的买入和卖出机会。当RSI从超卖区域向上突破,同时MACD柱状图由负转正时,产生买入信号。当RSI从超买区域向下突破,同时MACD柱状图由正转负时,产生卖出信号。
该策略还引入了两条指数移动平均线(EMA)作为额外的确认指标。较短周期的EMA(如10日EMA)和较长周期的EMA(如20日EMA)的交叉也可以用来确认RSI和MACD产生的信号。当价格在两条EMA上方时,进一步确认买入信号;当价格在两条EMA下方时,进一步确认卖出信号。
策略原理
计算RSI指标:使用Ta-Lib库的ta.rsi()函数计算RSI值。RSI是一个动量指标,用于衡量在给定时间段内价格变动的幅度。它的取值范围在0到100之间。
计算MACD指标:使用Ta-Lib库的ta.macd()函数计算MACD线、信号线和柱状图。MACD是一个趋势跟踪指标,由两条移动平均线的差值计算得出。
计算EMA指标:使用Ta-Lib库的ta.ema()函数计算10日EMA和20日EMA。EMA是一种权重降低的移动平均线,对最近的价格变动更敏感。
定义买入条件:当RSI从超卖区(默认为40以下)向上突破,同时MACD柱状图由负转正时,产生买入信号。这表明价格可能即将上涨。
定义卖出条件:当RSI从超买区(默认为60以上)向下突破,同时MACD柱状图由正转负时,产生卖出信号。这表明价格可能即将下跌。
使用EMA作为确认:当价格在10日EMA和20日EMA上方时,进一步确认买入信号;当价格在10日EMA和20日EMA下方时,进一步确认卖出信号。
绘制信号:在图表上用绿色向上三角形标记买入信号,用红色向下三角形标记卖出信号。
策略优势
结合多个指标:该策略结合了RSI、MACD和EMA三个常用的技术指标,提供了更可靠的交易信号。
趋势跟踪:MACD指标有助于识别价格趋势的变化,使策略能够适应不同的市场条件。
动量确认:RSI指标提供了价格动量的确认,有助于排除假信号。
简单易用:策略使用了简单的指标计算和信号定义,易于理解和实现。
适应性强:通过调整RSI和MACD的参数,可以优化策略以适应不同的市场和交易品种。
策略风险
参数敏感性:策略的表现可能对RSI和MACD的参数选择较为敏感。不恰当的参数可能导致信号质量下降。
延迟信号:由于MACD是基于移动平均线计算的,因此可能存在一定的信号延迟。这可能导致错过最佳的进场时机。
震荡市场:在震荡市场条件下,RSI和MACD可能会产生频繁的交叉信号,导致过度交易和资金损失。
缺乏止损:该策略没有明确定义止损条件,可能在价格剧烈波动时承受较大风险。
优化方向
引入趋势过滤:在产生买入或卖出信号之前,先确认价格处于明确的上升或下降趋势中。这可以通过评估长期移动平均线的方向或使用趋势指标来实现。
优化参数选择:通过对历史数据进行回测和优化,找出最佳的RSI和MACD参数组合,以提高信号的可靠性和准确性。
加入止损和止盈:为每个交易设置适当的止损和止盈水平,以限制潜在损失并保护利润。可以使用百分比或ATR等方法来确定止损和止盈位置。
考虑交易量:将交易量指标纳入策略,以确认价格变动的有效性。交易量的增加可以验证趋势的强度,而交易量的减少可能表明趋势即将反转。
结合其他指标:考虑将其他技术指标如布林带、随机指标等纳入策略,以提供额外的确认和过滤。
总结
RSI和MACD交叉策略是一个结合相对强弱指数、移动平均线收敛发散指标和指数移动平均线的交易策略。该策略通过识别RSI和MACD的交叉信号来产生买入和卖出信号,并使用EMA作为额外的确认。
该策略的优势在于结合了多个常用指标,能够适应不同的市场条件,并且易于理解和实现。然而,策略也存在一些风险,如参数敏感性、信号延迟和缺乏明确的止损规则。
为了改进策略,可以考虑引入趋势过滤、优化参数选择、加入止损和止盈、考虑交易量以及结合其他技术指标。这些优化可以提高策略的可靠性、准确性和风险管理能力。
总的来说,RSI和MACD交叉策略提供了一个基于动量和趋势的交易框架。通过适当的优化和风险管理,该策略可以成为识别潜在交易机会的有效工具。然而,在实际应用中,交易者需要根据自己的风险偏好和交易目标对策略进行调整和测试,以确保其适合自己的交易风格和市场环境。
/*backtest
start: 2024-02-01 00:00:00
end: 2024-02-29 23:59:59
period: 1h
basePeriod: 15m
exchanges: [{"eid":"Futures_Binance","currency":"BTC_USDT"}]
*/

//@version=5
strategy('RSIand macd bull and bear', overlay=true)

// Input parameters
length = input.int(14, title='RSI Length', minval=1)
overbought = input.int(60, title='RSI Overbought Level', minval=0, maxval=100)
oversold = input.int(40, title='RSI Oversold Level', minval=0, maxval=100)

ema30_length = input(10, title='EMA RSI')
ema50_length = input(20, title='EMA MACD')

// Calculate EMAs

ema30 = ta.ema(close, ema30_length)
ema50 = ta.ema(close, ema50_length)

// Calculate RSI
rsiValue = ta.rsi(close, length)

// Calculate MACD
[macdLine, signalLine, hist] = ta.macd(close, 12, 26, 9)

var float buyPrice = na

// Buy condition: EMA 3 crosses above EMA 30 and price is above EMA 50
buyCondition =  rsiValue > oversold and ta.crossover(hist,0) or ta.crossover(rsiValue,oversold) and hist>0
if (buyCondition)
    // buyPrice := close
    strategy.entry('Buy', strategy.long)

// Exit long position when close is below EMA30 and below the low of the previous 3 candles after the buy entry0
//exitLongCondition = close < ema30 and close < ta.lowest(low, 3) and close < buyPrice
//if (exitLongCondition)
  //  strategy.close('BuyExit')

// Sell condition: EMA 3 crosses below EMA 30 and price is below EMA 50
sellCondition = rsiValue < overbought and ta.crossunder(hist,0) or ta.crossunder(rsiValue, overbought) and hist<0
if (sellCondition)
    strategy.entry('Sell', strategy.short)

// Exit short position when close is above EMA30 and above the high of the previous 3 candles after the sell entry
//exitShortCondition = close > ema30 and close > ta.highest(high, 3)
//if (exitShortCondition)
  //  strategy.close('SellExit')

// Plot EMAs on the chart


// Change color of EMA 50 based on MACD histogram
ema50Color = hist > 0 ? color.new(color.green, 0) :  hist<0 ? color.new(color.red, 0) : color.new(color.black, 0)
plot(ema50, color=ema50Color, title='EMA 50 Colored')

// Change color of EMA 30 based on RSI trend
ema30Color = rsiValue > oversold ? color.new(color.green, 0) : rsiValue<overbought ? color.new(color.red, 0) : color.new(color.black, 0)
plot(ema30, color=ema30Color, title='EMA 30 Colored')

// Highlight Buy and Sell signals on the chart
// bgcolor(buyCondition ? color.new(color.green, 90) : na)
// bgcolor(sellCondition ? color.new(color.red, 90) : na)

// Plotting Buy and Sell Signals on the Chart until strategy exit
barcolor(strategy.position_size > 0 and rsiValue > overbought ? color.new(color.yellow, 0) : strategy.position_size < 0 and rsiValue < oversold ? color.new(color.black, 0) : na)
// plotshape(buyCondition,  title = "Buy",  text = 'Buy',  style = shape.labelup,   location = location.belowbar, color= color.green,textcolor = color.white, transp = 0, size = size.tiny)
// plotshape(sellCondition, title = "Sell", text = 'Sell', style = shape.labeldown, location = location.abovebar, color= color.red,textcolor = color.white, transp = 0, size = size.tiny)

plotshape(buyCondition, color=color.green, style=shape.triangleup, size=size.small, location=location.belowbar, text="Buy")
plotshape(sellCondition, color=color.red, style=shape.triangledown, size=size.small, location=location.abovebar, text="Sell")