TrendHunter w/MF Multi-Timeframe Trend Strategy

Overview
TrendHunter w/MF Multi-Timeframe Trend Strategy is a trend-following strategy based on the comprehensive analysis of multiple technical indicators across multiple timeframes. This strategy takes into account factors such as Ichimoku Cloud, Moving Averages, SuperTrend, WaveTrend, and MoneyFlow, using strict conditions to determine entry points and capture the main trends of the market.
Strategy Principle
The core principle of this strategy is the comprehensive analysis of multiple technical indicators across multiple timeframes. Specifically:
-
Ichimoku Cloud: By analyzing the relative position of price and cloud, as well as the relative position of moving averages and cloud, the current market trend is determined. When the price is above the cloud and the moving average is also above the cloud, it is considered an uptrend; otherwise, it is considered a downtrend.
-
SuperTrend: By analyzing the relative position of price and SuperTrend, the current market trend is confirmed. When the price is above the SuperTrend, it is considered an uptrend; otherwise, it is considered a downtrend.
-
WaveTrend: By analyzing the direction and position of the WaveTrend indicator, the current market trend is determined. When the WaveTrend is rising and has not reached the overbought zone, it is considered an uptrend; when the WaveTrend is falling and has not reached the oversold zone, it is considered a downtrend.
-
MoneyFlow: By analyzing the state of the MoneyFlow indicator, the current market trend is confirmed. When the MoneyFlow is positive, it is considered an uptrend; otherwise, it is considered a downtrend.
For long positions, the strategy requires the price to be above the cloud, the moving average to be above the cloud, the SuperTrend to be up, the WaveTrend to be rising and not in the overbought zone, and the MoneyFlow to be positive. The opposite applies for short positions. This strict filtering based on multiple indicators across multiple timeframes can effectively avoid frequent trading in range-bound markets, thereby improving the stability and reliability of the strategy.
Advantage Analysis
-
Comprehensive judgment based on multiple indicators, high reliability: This strategy comprehensively considers multiple technical indicators, which complement each other under different market conditions, providing a comprehensive reflection of market trends and avoiding the errors that may occur with a single indicator.
-
Strict entry conditions, avoiding frequent trading: The strategy sets strict entry conditions, requiring multiple indicators to be satisfied simultaneously before entering a position, which effectively avoids frequent trading in range-bound markets and reduces the attrition of the strategy.
-
Multi-timeframe analysis, grasping the big trend: The strategy performs analysis across multiple timeframes, which helps the strategy grasp the main trends of the market from a larger perspective, avoiding interference from short-term noise.
-
Clear stop-loss strategy, controllable risk: The strategy uses SuperTrend as a stop-loss condition. Once the market trend changes, the strategy can stop loss in a timely manner, keeping losses within an acceptable range.
Risk Analysis
-
Lack of dynamic adjustment, limited ability to respond to market changes: The parameter settings of this strategy are fixed and lack the ability to dynamically adjust according to market conditions. When market conditions change significantly, the strategy may fail.
-
Overly strict entry conditions may miss good opportunities: The entry conditions of the strategy are very strict, which, although it can avoid frequent trading, may also lead to the strategy missing some good entry opportunities.
-
Adaptability to extreme market conditions is unknown: The strategy performs well under normal market conditions, but its adaptability to some extreme market conditions, such as rapid and substantial reversals, remains to be tested.
-
Relatively simple stop-loss strategy, room for optimization: Currently, the strategy only uses SuperTrend as a stop-loss condition. Although this is simple and straightforward, there is further room for optimization in the stop-loss strategy to better control risk.
Optimization Directions
-
Introduce market condition judgment, dynamically adjust parameters: Consider introducing some market condition judgment indicators, such as volatility indicators, to dynamically adjust strategy parameters according to changes in market conditions to adapt to different market environments.
-
Optimize entry conditions, improve sensitivity: Consider optimizing the entry conditions, such as introducing more confirmation indicators, to improve the sensitivity of the strategy while ensuring reliability, capturing more trading opportunities.
-
Add response measures for extreme market conditions: For some extreme market conditions, such as rapid and substantial reversals, consider introducing some special response measures, such as increasing the intensity of stop-loss or suspending trading, to reduce the risk of the strategy under extreme market conditions.
-
Optimize stop-loss strategy, improve risk control capabilities: Consider introducing more stop-loss conditions, such as time stop-loss, range stop-loss, etc. Also consider introducing some dynamic stop-loss strategies, such as trailing stop-loss, to better control risk.
Summary
TrendHunter w/MF Multi-Timeframe Trend Strategy is a trend-following strategy based on multi-indicator, multi-timeframe analysis. This strategy, through the comprehensive consideration of factors such as Ichimoku Cloud, Moving Averages, SuperTrend, WaveTrend, and MoneyFlow, strict entry condition settings, and multi-timeframe analysis, can capture the main trends of the market relatively reliably, avoiding frequent trading in range-bound markets, and has good stability and reliability.
At the same time, this strategy also has some limitations and risks, such as the lack of dynamic adjustment capabilities, potentially overly strict entry conditions, unknown adaptability to extreme market conditions, and a relatively simple stop-loss strategy. These are all areas where this strategy can be optimized and improved in the future.
Overall, TrendHunter w/MF Multi-Timeframe Trend Strategy is a trend-following strategy with good potential. When using this strategy, traders should fully understand its principles, advantages, and risks, and make necessary adjustments and optimizations according to their own risk preferences and trading styles. At the same time, they should also closely monitor changes in market conditions and adjust the strategy in a timely manner to adapt to market changes. Only on the basis of in-depth understanding and prudent use can this strategy give full play to its potential advantages and bring stable returns for traders.
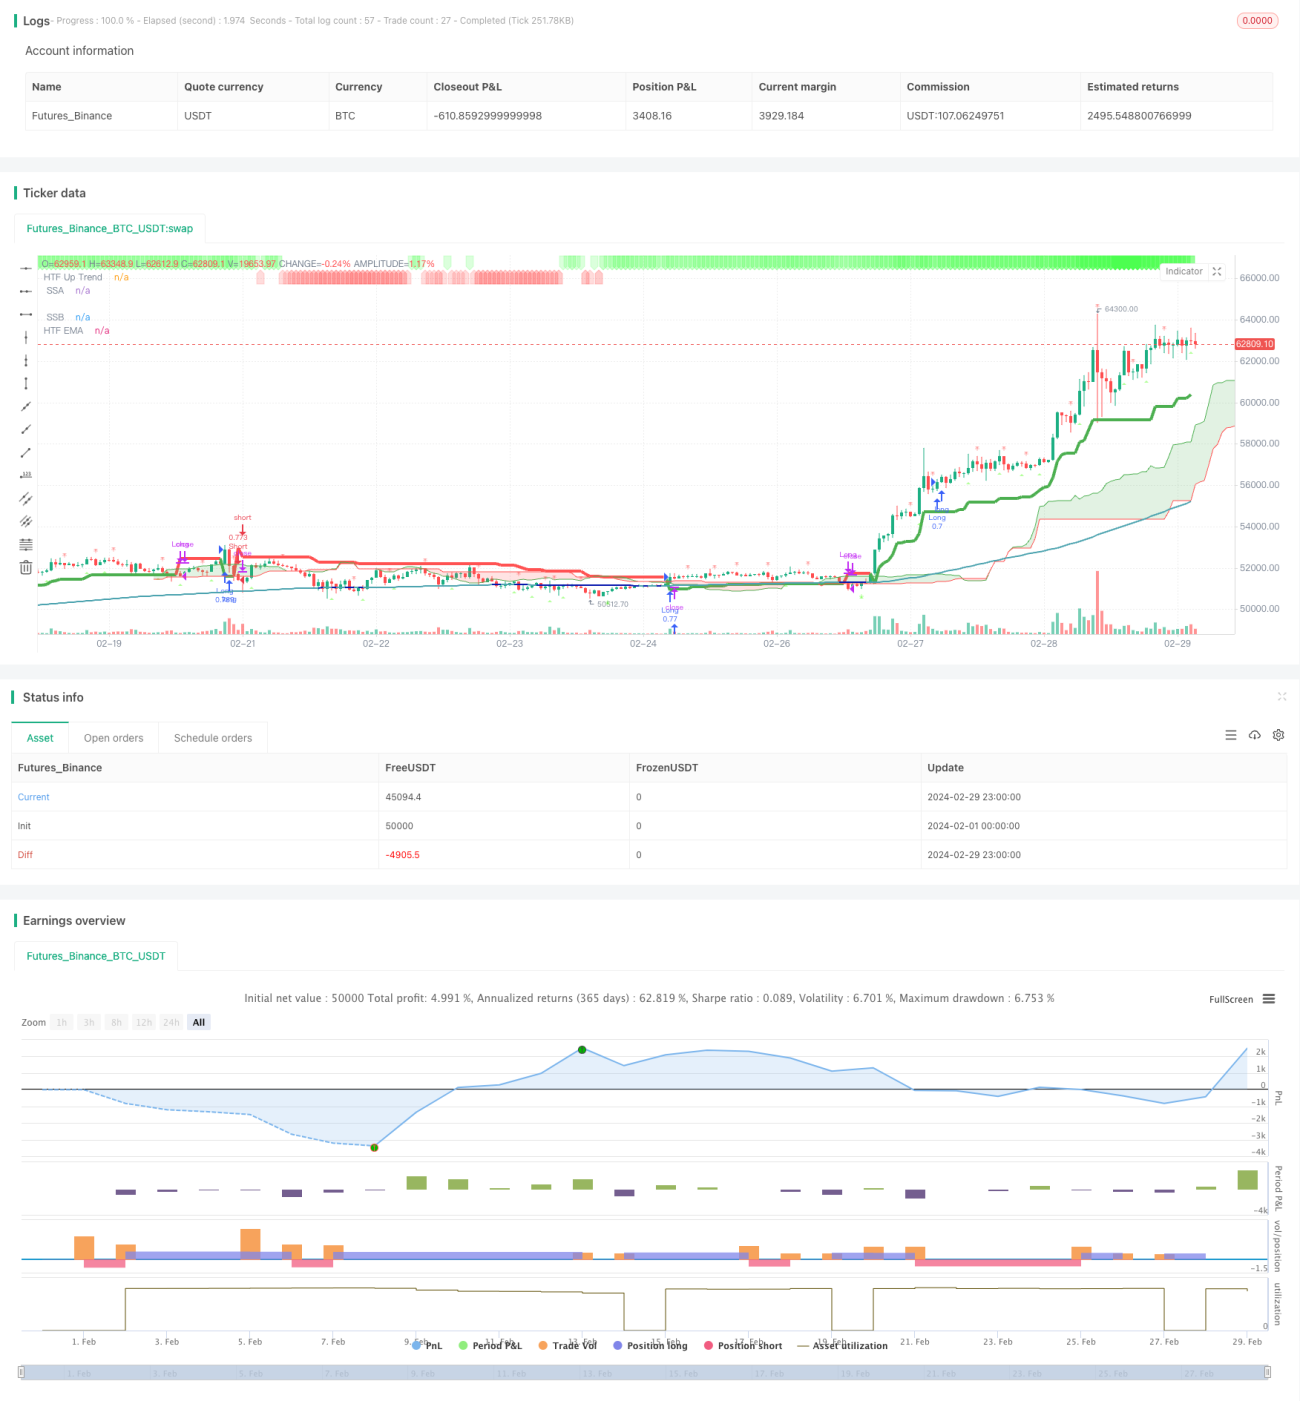
/*backtest
start: 2024-02-01 00:00:00
end: 2024-02-29 23:59:59
period: 1h
basePeriod: 15m
exchanges: [{"eid":"Futures_Binance","currency":"BTC_USDT"}]
*/

// This Pine Script™ code is subject to the terms of the Mozilla Public License 2.0 at https://mozilla.org/MPL/2.0/
// © godzcopilot / blockybears

// Thanks to anthonyf50 for his MTF Ichimoku https://www.tradingview.com/script/Pw9cBFma/- 1