概述
该策略通过识别早盘9:15的高低点,自动计算多空头寸的目标价和止损价,并在满足条件时自动开仓。策略利用相对强弱指标(RSI)来判断超买和超卖状态,结合9:15高低点突破来确定入场机会。
策略原理
- 确定9:00至9:15为高低点形成区间。
- 记录9:15时的最高价和最低价分别为sessionHigh和sessionLow。
- 分别计算多头目标价(sessionHigh+200)、空头目标价(sessionLow-200)以及相应的止损价。
- 获取当前收盘价以及RSI指标。
- 多头开仓条件:收盘价突破sessionHigh且RSI大于超买level。
- 空头开仓条件:收盘价跌破sessionLow且RSI小于超卖level。
- 绘制相关价位,并根据开仓条件自动开多头或空头。
优势分析
- 简单易用:策略基于明确的9:15高低点和RSI指标,逻辑清晰,容易理解和实施。
- 自动化程度高:策略内置了目标价和止损价的计算以及开仓条件的判断,可以自动化执行交易。
- 及时止损:根据9:15高低点设置止损价,一旦开仓即有明确止损位,可以有效控制风险。
- 趋势跟踪:通过RSI指标判断超买超卖,在趋势形成初期介入,有助于顺势而为。
风险分析
- 参数优化风险:策略参数如RSI的长度和超买超卖阈值等需要根据市场特征进行优化,不同参数可能带来不同结果。
- 单一指标风险:策略主要依赖RSI指标,在某些市场情况下可能出现指标失效的情况。
- 盘中波动风险:9:15之后的价格波动可能触发止损而错失趋势行情。
- 缺乏仓位管理:策略缺乏对仓位的控制和资金管理,过于频繁开仓可能带来额外风险。
优化方向
- 动态止损:根据价格波动幅度或ATR等指标对止损位进行动态调整,跟踪价格变化。
- 结合其他指标:引入如MACD、均线系统等其他指标对趋势判断形成印证,提高开仓准确性。
- 优化入场条件:对RSI超买超卖阈值进行自适应调整,避免固定阈值带来的局限性。
- 引入仓位管理:根据市场波动状况对仓位进行控制,例如采用百分比风险模型等方法。
总结
该策略以9:15高低点为基础,运用RSI指标进行趋势判断,自动计算目标价和止损价,并根据开仓条件自动开立多头或空头仓位。策略逻辑简单明了,自动化程度较高,可以快速捕捉趋势行情。但是,策略也存在参数优化、单一指标、盘中波动以及仓位管理等方面的风险。未来可以从动态止损、结合其他指标、优化入场条件和引入仓位管理等方面对策略进行优化和改进,以期获得更稳健的交易表现。
策略源码
/*backtest
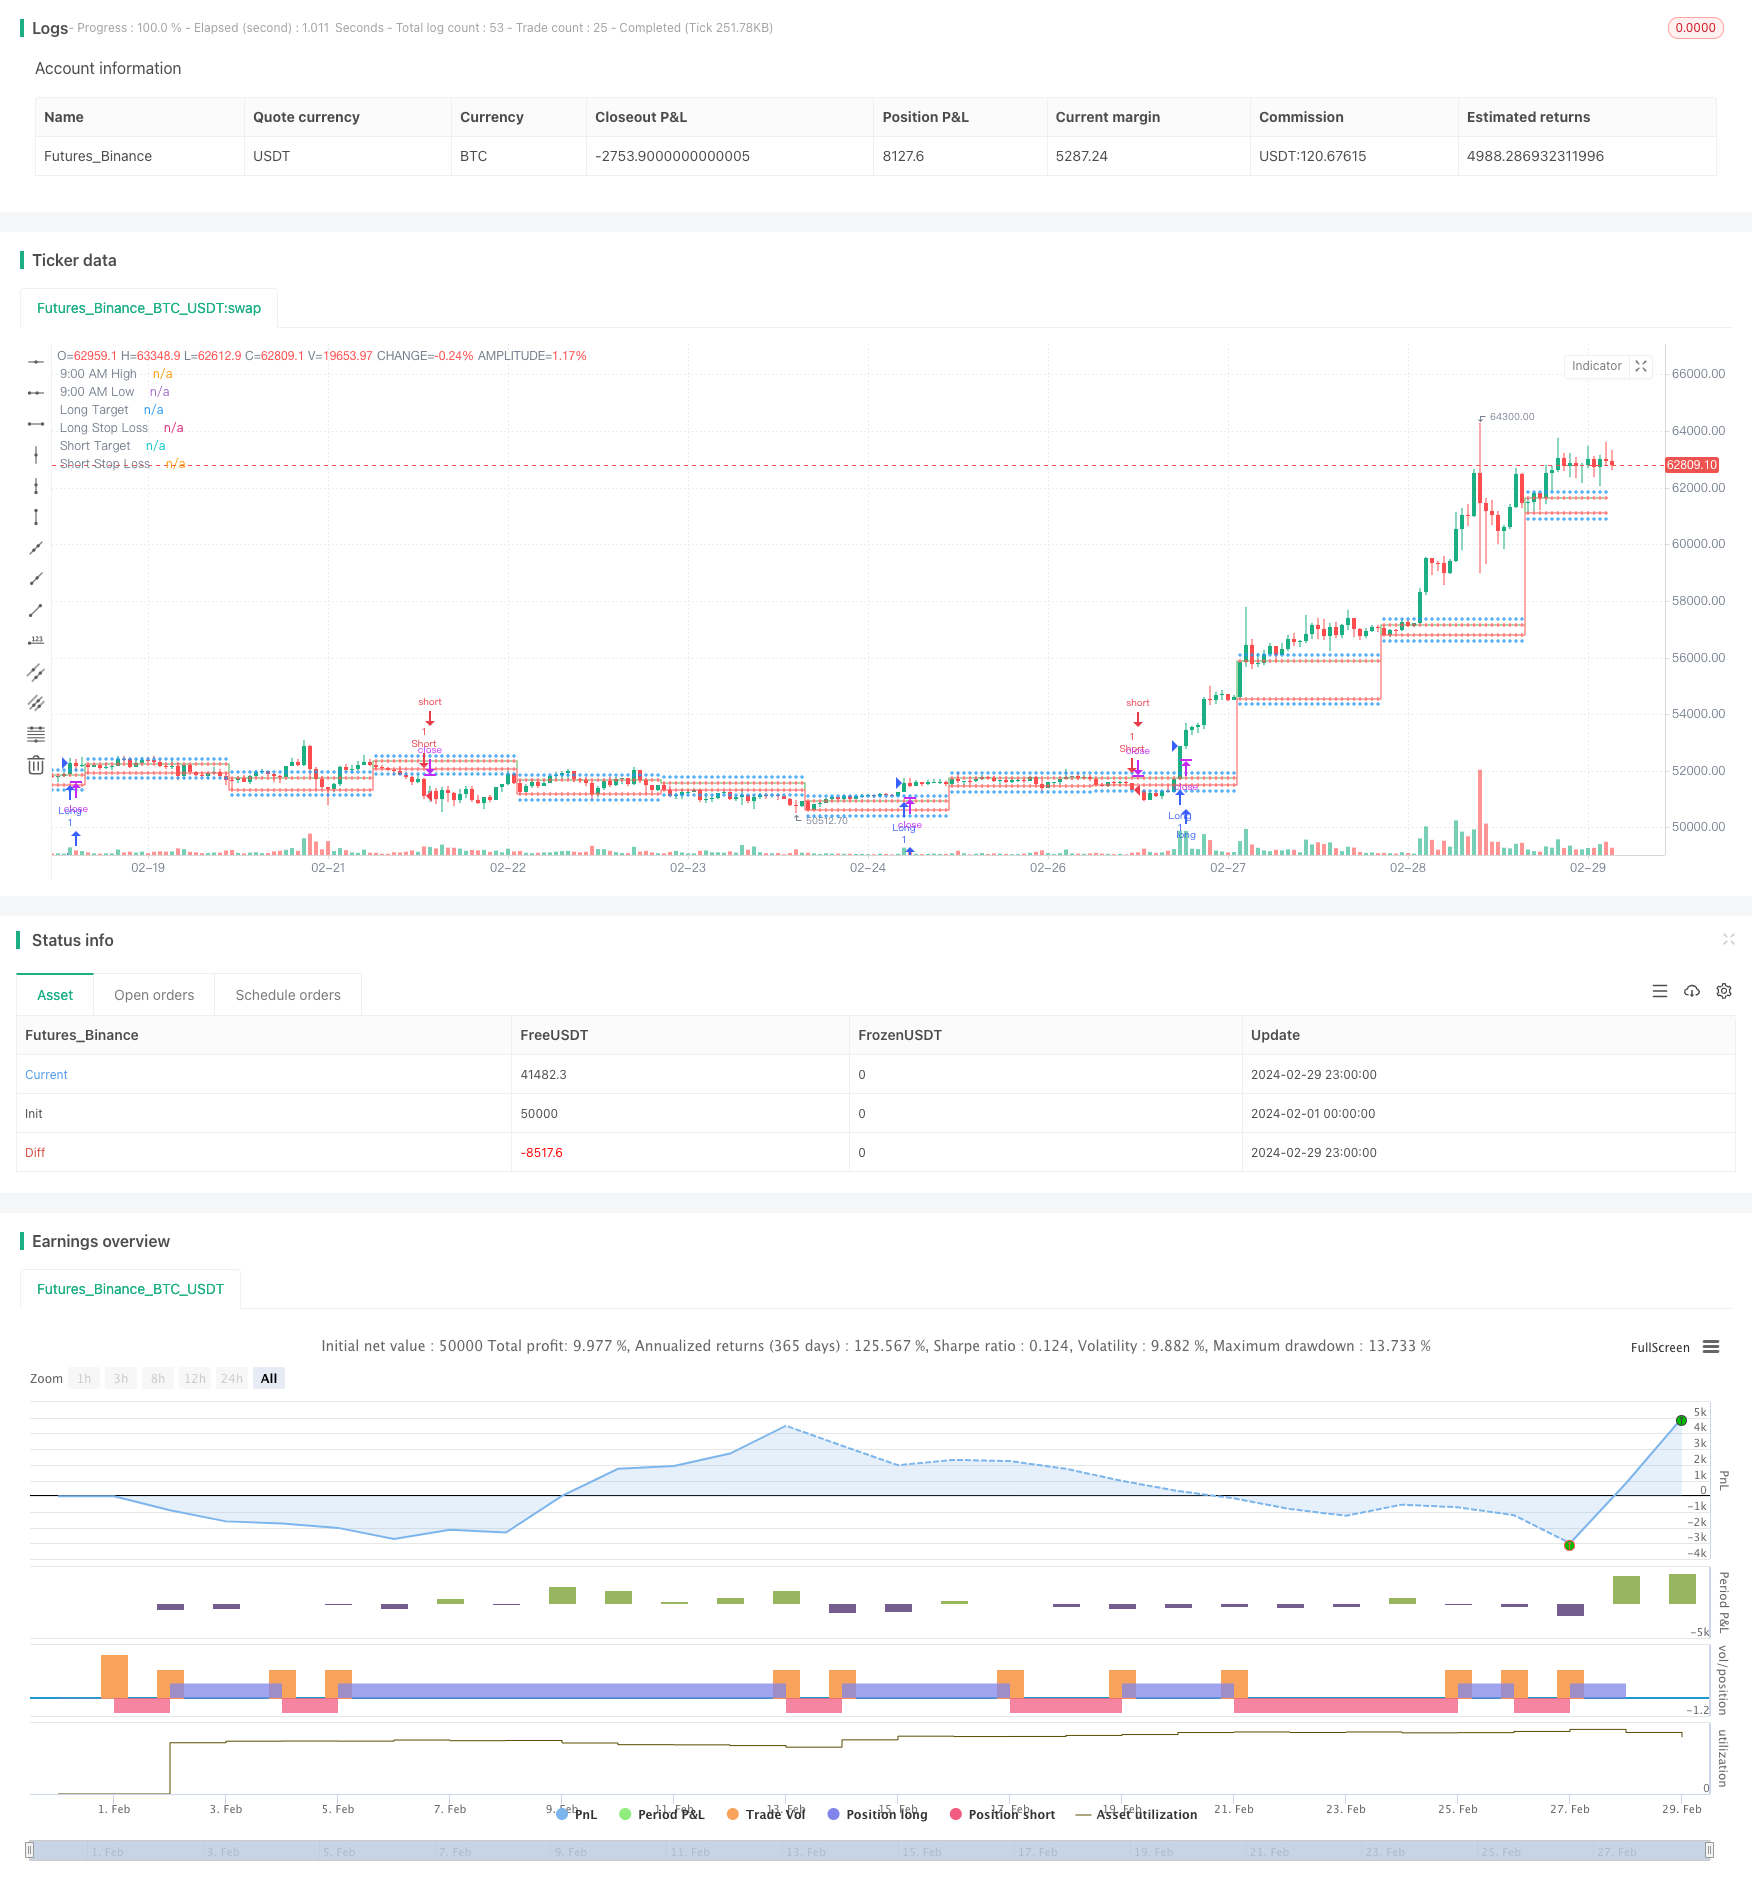
start: 2024-02-01 00:00:00
end: 2024-02-29 23:59:59
period: 1h
basePeriod: 15m
exchanges: [{"eid":"Futures_Binance","currency":"BTC_USDT"}]
*/
//@version=5
strategy("9:15 AM High/Low with Automatic Forecasting", overlay=true)
// Parameters
showSignals = input(true, title="Show Signals")
// Define session time
sessionStartHour = input(9, title="Session Start Hour")
sessionStartMinute = input(0, title="Session Start Minute")
sessionEndHour = input(9, title="Session End Hour")
sessionEndMinute = input(15, title="Session End Minute")
// Calculate session high and low
var float sessionHigh = na
var float sessionLow = na
if (hour == sessionStartHour and minute == sessionStartMinute)
sessionHigh := high
sessionLow := low
// Update session high and low if within session time
if (hour == sessionStartHour and minute >= sessionStartMinute and minute < sessionEndMinute)
sessionHigh := high > sessionHigh or na(sessionHigh) ? high : sessionHigh
sessionLow := low < sessionLow or na(sessionLow) ? low : sessionLow
// Plot horizontal lines for session high and low
plot(sessionHigh, color=color.green, title="9:00 AM High", style=plot.style_stepline, linewidth=1)
plot(sessionLow, color=color.red, title="9:00 AM Low", style=plot.style_stepline, linewidth=1)
// Calculate targets and stop loss
longTarget = sessionHigh + 200
longStopLoss = sessionLow
shortTarget = sessionLow - 200
shortStopLoss = sessionHigh
// Plot targets and stop loss
plot(longTarget, color=color.blue, title="Long Target", style=plot.style_cross, linewidth=1)
plot(longStopLoss, color=color.red, title="Long Stop Loss", style=plot.style_cross, linewidth=1)
plot(shortTarget, color=color.blue, title="Short Target", style=plot.style_cross, linewidth=1)
plot(shortStopLoss, color=color.red, title="Short Stop Loss", style=plot.style_cross, linewidth=1)
// RSI
rsiLength = input(14, title="RSI Length")
overboughtLevel = input(60, title="Overbought Level")
oversoldLevel = input(40, title="Oversold Level")
rsi = ta.rsi(close, rsiLength)
// Entry conditions
longCondition = close > sessionHigh and rsi > overboughtLevel
shortCondition = close < sessionLow and rsi < oversoldLevel
// Long entry
if (showSignals and longCondition)
strategy.entry("Long", strategy.long)
// Short entry
if (showSignals and shortCondition)
strategy.entry("Short", strategy.short)