策略名称
双移动平均线交叉量化交易策略(Dual Moving Average Crossover Quantitative Trading Strategy)
策略概述
该策略基于两条不同周期的移动平均线(MA)的交叉信号来进行交易决策。当短期MA上穿长期MA时,产生买入信号;当短期MA下穿长期MA时,产生卖出信号。该策略试图捕捉价格的中长期趋势,通过趋势追踪来获取profits。
策略原理
该策略使用两条不同周期的移动平均线作为主要的技术指标。一条是短期移动平均线,用于反映价格的短期趋势;另一条是长期移动平均线,用于反映价格的中长期趋势。当短期MA与长期MA发生交叉时,往往意味着趋势发生了改变。
具体来说,当短期MA上穿长期MA时,表明价格可能进入上升趋势,此时策略会产生买入信号。反之,当短期MA下穿长期MA时,表明价格可能进入下降趋势,此时策略会产生卖出信号。这种趋势跟踪的方法可以帮助投资者顺应市场趋势,获取价格上涨或下跌的profits。
在该策略的代码实现中,主要使用了以下步骤:
1. 通过input函数设置短期MA和长期MA的周期参数,方便用户自定义。
2. 使用ta.sma函数计算短期MA。
3. 通过比较收盘价与短期MA的大小关系,判断价格是在MA上方还是下方。
4. 通过判断收盘价与短期MA的关系在两个连续bar之间是否发生变化,来确定是否产生买入或卖出信号。
5. 通过strategy.entry函数根据买卖信号进行交易。
6. 使用plotshape函数在图表上标注买卖信号。
7. 使用plot函数在图表上绘制短期MA曲线。
通过这些步骤的有机结合,该策略可以根据移动平均线的交叉变化,动态地调整仓位,试图持续获取市场趋势带来的profits。
策略优势
- 简单易懂:该策略只使用了移动平均线一个技术指标,原理简单清晰,容易理解和实现。
- 适应性强:通过灵活设置两条移动平均线的周期参数,可以适应不同的市场特点和投资需求。
- 趋势跟踪:策略基于移动平均线交叉来判断趋势,可以有效地捕捉价格的中长期趋势,顺应市场趋势来进行交易。
- 易于优化:可以通过优化移动平均线的周期参数,来提高策略的robustness和profits能力。
- 适用性广:该策略可以应用于各种金融市场和交易品种,如股票、期货、外汇等。
策略风险
- 参数敏感:策略的效果对移动平均线周期参数比较敏感,参数设置不当可能导致性能下降。
- 幅度敏感:当价格fluctuation幅度较大时,频繁的交叉信号可能导致过多的交易,增加成本。
- 震荡市:在震荡市场中,价格在移动平均线上下频繁波动,可能产生较多的falsepositive信号。
- 滞后性:移动平均线是滞后指标,交叉信号产生时,价格可能已经运行了一段时间,略有滞后。
- 单一指标:该策略只依赖移动平均线一个指标,可能缺乏对市场的全面考量,面临一定的局限性风险。
针对这些风险,可以采取以下措施来改进策略: 1. 通过参数优化来寻找最佳的移动平均线周期组合,提高稳健性。 2. 引入其他技术指标或市场信号,如volume、momentum等,丰富策略的考量维度。 3. 设置合理的止盈止损rules,控制单次交易风险。 4. 对交易信号进行过滤,如要求连续多根K线确认趋势改变,减少falsepositive。 5. 定期review和调整策略,适应市场的动态变化。
策略优化
- 参数优化:可以使用 walk forward analysis、grid search 等方法,对移动平均线的周期参数进行优化,寻找最佳的参数组合,提高策略的robustness和profits能力。优化的周期参数可以根据不同的市场特点和投资风格进行调整。
- 信号过滤:在产生交易信号后,可以通过一些过滤rules来提高信号的质量,如要求短期MA与长期MA维持一定的差距、要求价格在MA交叉后有一定的follow through、要求多个时间周期同步确认信号等,以减少falsepositive信号。
- 止盈止损:可以为每笔交易设置合理的止盈止损rules,一方面防范单次交易的downside风险,另一方面及时锁定profits。止盈止损的位置可以根据价格的votalility、support和resistance等因素动态调整。
- 仓位管理:可以根据市场趋势的强度、账户风险承受能力等因素,对每笔交易的仓位大小进行动态调整,在趋势强劲时加大仓位,在趋势转弱时减小仓位,以更好地适应市场。
- 多指标结合:可以将其他技术指标或市场信号与移动平均线结合使用,如 MACD、RSI、ATR 等,从多个维度对趋势进行判断和确认,提高策略的可靠性。不同指标之间的权重可以根据其在不同市场状态下的稳定性进行调配。
这些优化方向的目的是提高策略的适应性、稳健性和profits能力,更好地应对市场的变化和挑战。通过不断的优化和改进,可以使策略在实际应用中取得更好的效果。
总结
双移动平均线交叉量化交易策略是一个简单易懂、适应性强的趋势跟踪策略。它通过两条不同周期移动平均线的交叉变化来判断价格趋势,试图捕捉市场的中长期机会。该策略的优势在于原理简单清晰,易于实现和优化,适用于多种金融市场。但同时也存在参数敏感、震荡市表现欠佳、信号滞后等风险。
为了改进策略,可以从参数优化、信号过滤、仓位管理、多指标结合等方面入手,提高策略的适应性和稳健性。定期review和调整策略也是必要的,以适应市场的动态变化。
总的来说,双移动平均线交叉策略提供了一个基本的量化交易framework,但在实际应用中还需要根据具体的市场特点和投资需求进行优化和改进,以取得更好的效果。对于量化交易者而言,研究和优化该策略可以帮助理解市场规律,积累宝贵的实战经验。
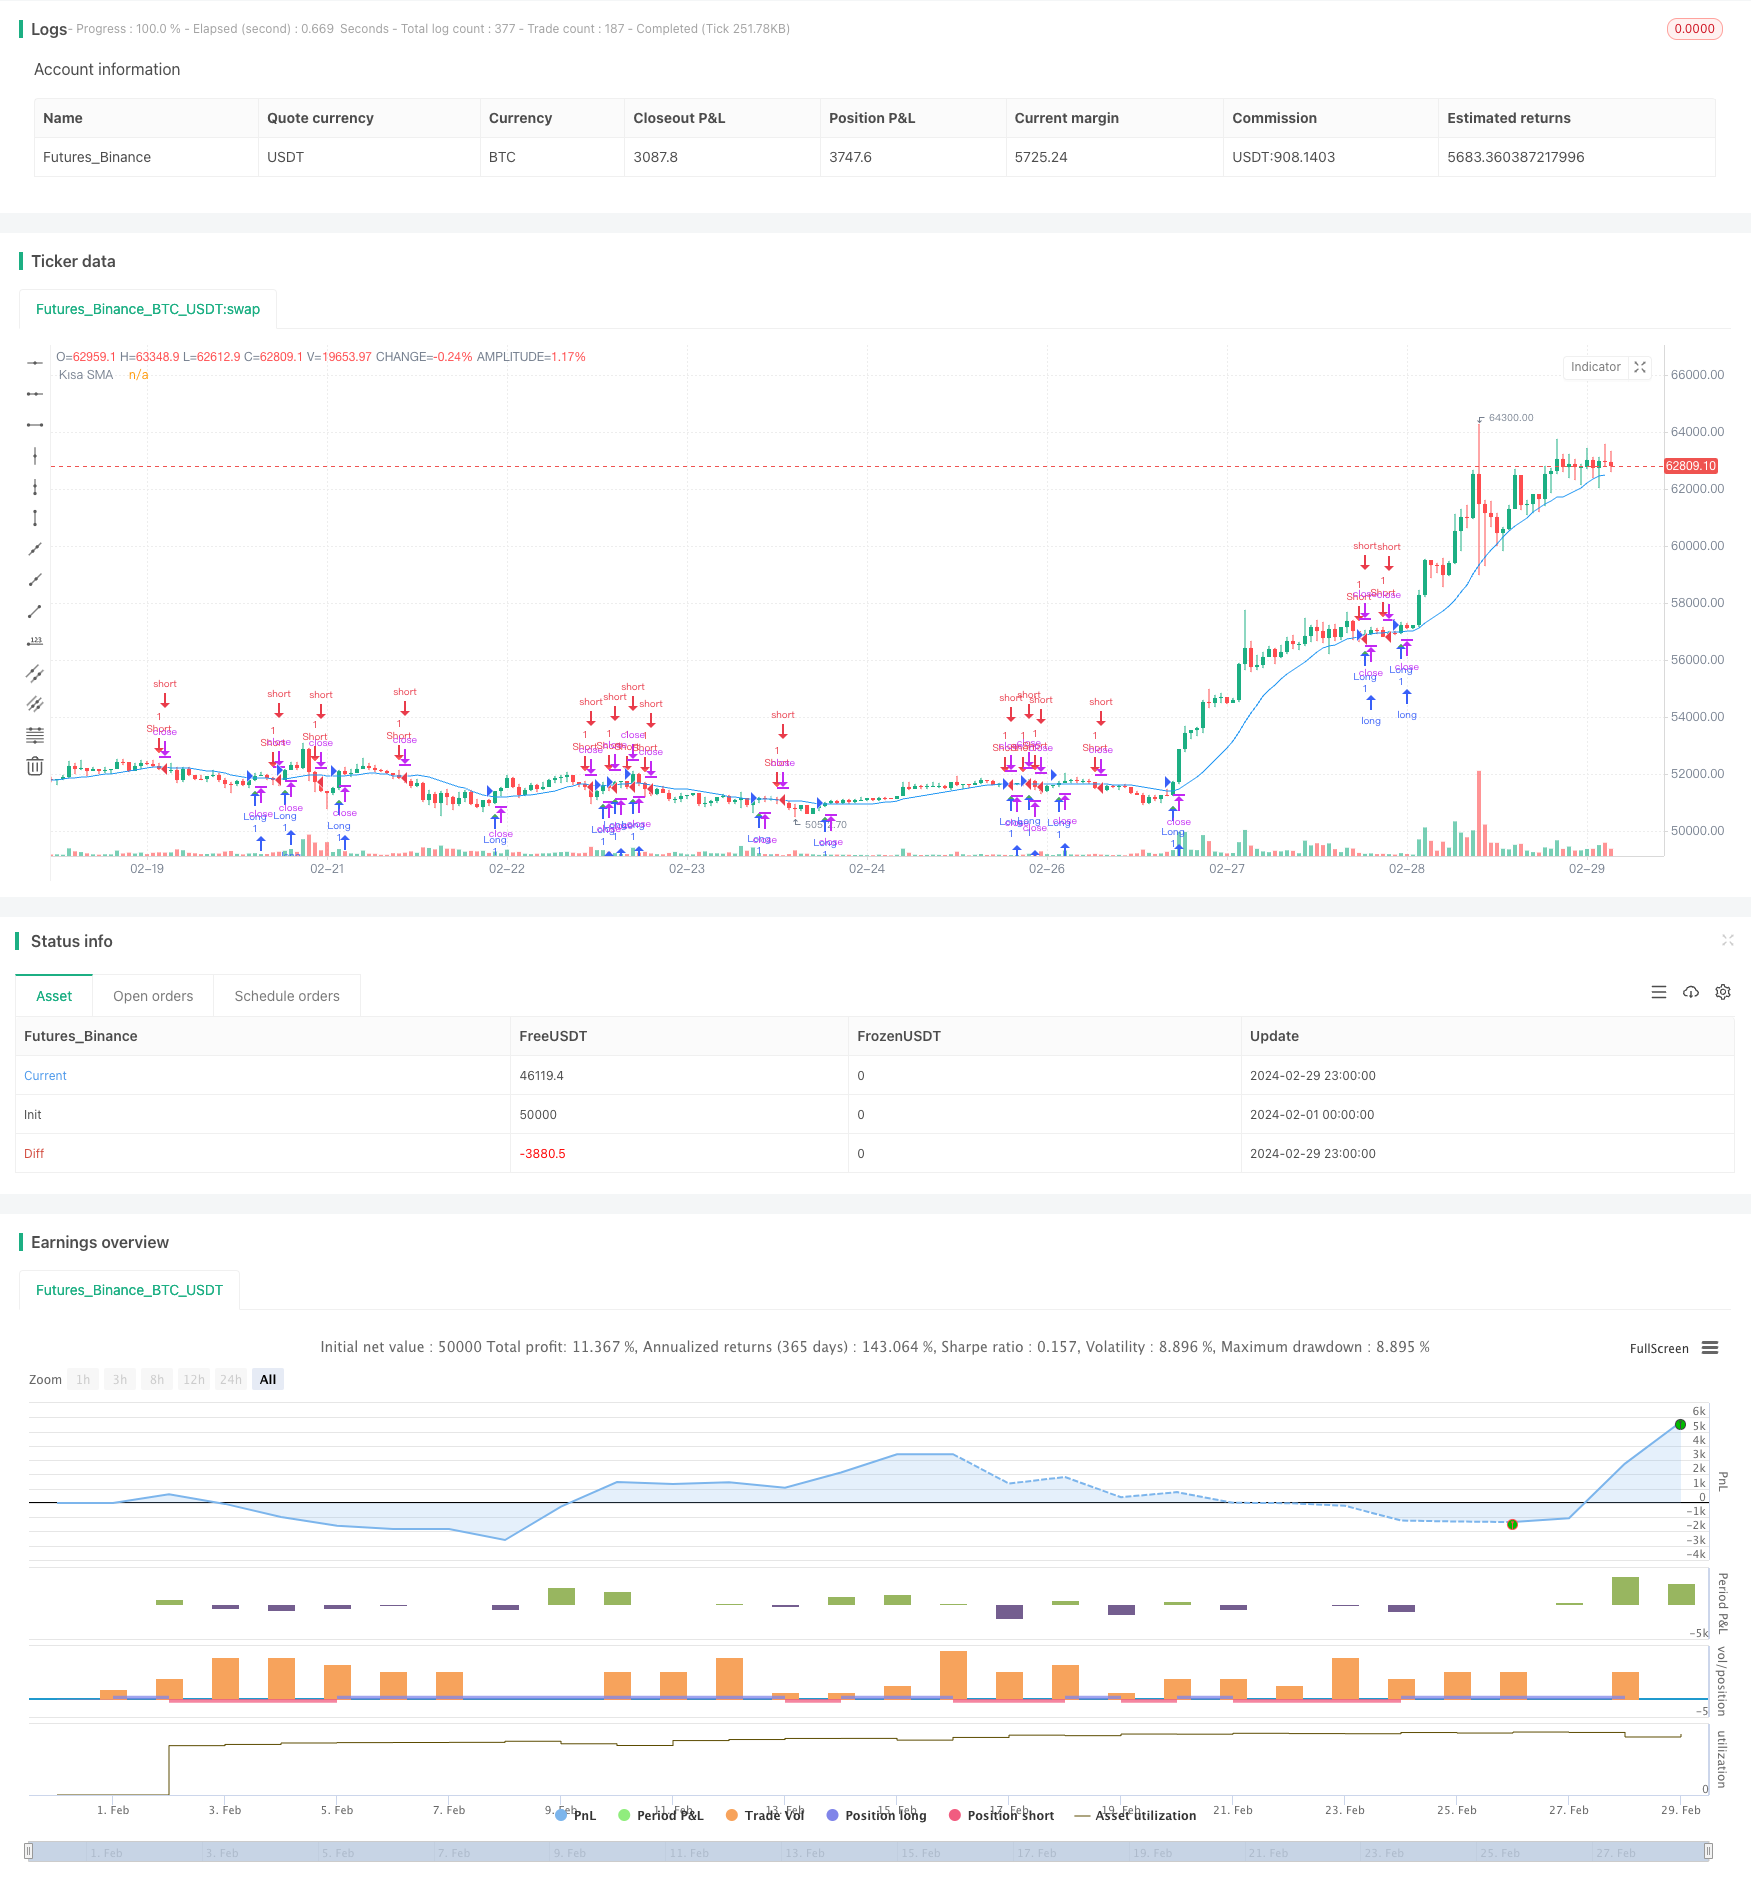
/*backtest
start: 2024-02-01 00:00:00
end: 2024-02-29 23:59:59
period: 1h
basePeriod: 15m
exchanges: [{"eid":"Futures_Binance","currency":"BTC_USDT"}]
*/

//@version=5
strategy("SMA Crossover Strategy", overlay=true)

// SMA parametrelerini ayarla
sma_short_length = input.int(15, "Kısa SMA Uzunluğu")
sma_long_length = input.int(200, "Uzun SMA Uzunluğu")

// Hareketli ortalama hesaplamalarını yap
sma_short = ta.sma(close, sma_short_length)

// Fiyatın SMA'yı yukarı veya aşağı kestiğini kontrol et
price_above_sma = close > sma_short
price_below_sma = close < sma_short

// Alım-Satım noktalarını belirle
longCondition = (close[1] < sma_short[1] and close > sma_short) and price_above_sma
shortCondition = (close[1] > sma_short[1] and close < sma_short) and price_below_sma

// Al-Sat stratejisi
if (longCondition)
    strategy.entry("Long", strategy.long)
if (shortCondition)
    strategy.entry("Short", strategy.short)

// Fiyatın kısa SMA'yı yukarı kesme noktalarını göster
plotshape(series=longCondition, title="Long", location=location.belowbar, color=color.green, style=shape.triangleup, size=size.small)

// Fiyatın kısa SMA'yı aşağı kesme noktalarını göster
plotshape(series=shortCondition, title="Short", location=location.abovebar, color=color.red, style=shape.triangledown, size=size.small)

// Hareketli ortalamaları grafiğe çiz
plot(sma_short, color=color.blue, title="Kısa SMA")