资源加载中... loading...

SMC Strategy Combining MACD and EMA

Author: ChaoZhang, Date: 2024-03-19 17:37:45
Tags:

img

Strategy Overview

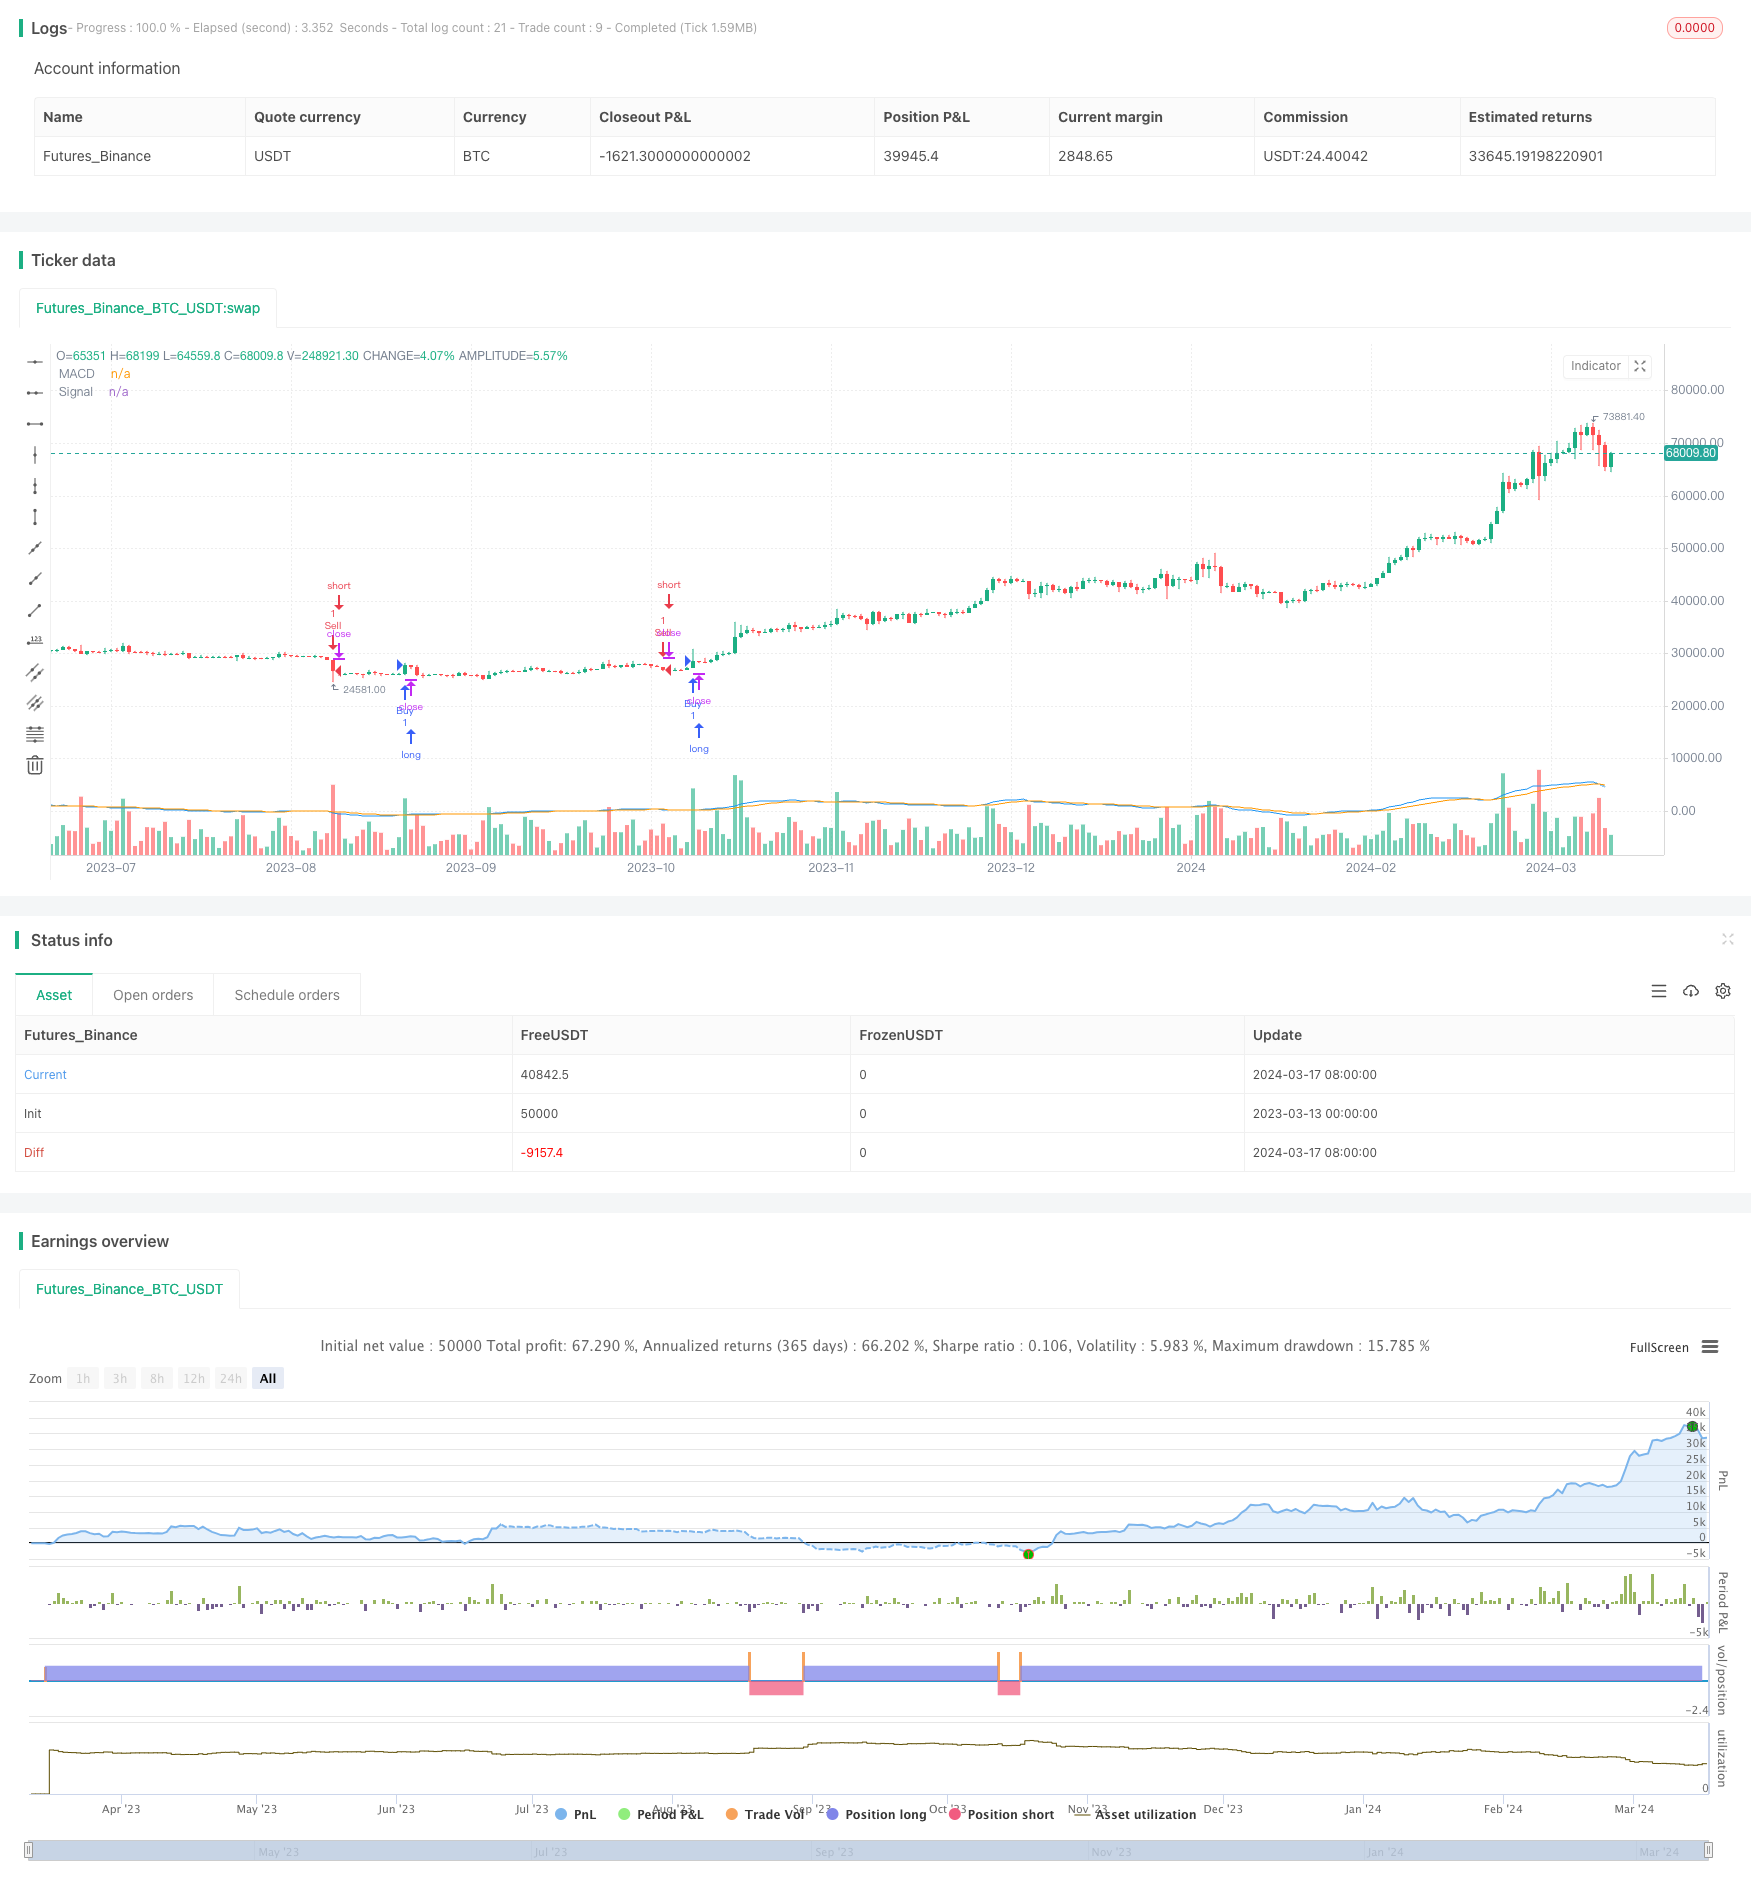
This strategy mainly uses the MACD indicator and EMA indicator to determine market trends, combined with the buy and sell signals from the Lux Algo SMC indicator. It buys when the trend is up and the price is above the EMA, and sells when the trend is down and the price is below the EMA. In this way, the strategy can profit from trend markets while avoiding frequent trading in rangebound markets.

Strategy Principle

The core of this strategy is the MACD indicator and EMA indicator. The MACD indicator consists of two lines: the MACD line and the signal line. When the MACD line crosses above the signal line from below, it indicates that the trend may be turning up, and when the MACD line crosses below the signal line from above, it indicates that the trend may be turning down. The EMA indicator is used to determine whether the price is above the moving average, thus confirming the current trend direction.

Specifically, the logic of this strategy is as follows:

  1. Calculate the three variables of the MACD indicator: macdLine, signalLine, and hist.
  2. Calculate the value of the EMA indicator: emaValue.
  3. Get the buy and sell signals from the Lux Algo SMC indicator: buySignal and sellSignal.
  4. When buySignal is true, and macdLine is greater than signalLine, and the closing price is greater than emaValue, open a long position.
  5. When sellSignal is true, and macdLine is less than signalLine, and the closing price is less than emaValue, open a short position.

In this way, the strategy can enter the market in a timely manner during trending markets, while avoiding frequent trading in rangebound markets, thus improving the stability and profitability of the strategy.

Strategy Advantages

  1. Strong trend tracking ability: By combining the MACD and EMA indicators, the strategy can timely determine market trends and profit from trending markets.
  2. Avoid frequent trading: By introducing the EMA indicator, the strategy can avoid frequent trading in rangebound markets, thereby reducing trading costs and drawdowns.
  3. Adjustable parameters: The parameters of the strategy can be adjusted according to market conditions, thus improving the adaptability of the strategy.
  4. Concise code: The code logic of the strategy is clear and easy to understand and modify.

Strategy Risks

  1. Parameter sensitivity: The performance of the strategy is relatively sensitive to parameter settings, and different parameter combinations may lead to large differences in strategy performance. Therefore, parameters need to be optimized and tested in practical applications.
  2. Trend misjudgment: The strategy mainly relies on the MACD and EMA indicators to determine trends, but both indicators may send false signals, leading to strategy losses. Therefore, it is necessary to combine other indicators or methods to verify the reliability of the trend.
  3. Sudden event risk: The strategy cannot cope with some sudden events, such as major bearish news, black swan events, etc., which may cause the strategy to suffer large drawdowns. Therefore, appropriate stop-loss measures need to be set to control risks.

Strategy Optimization Directions

  1. Introduce more indicators: Consider introducing other trend-type indicators, such as ADX, DMI, etc., to verify the reliability of the MACD and EMA indicators and improve the accuracy of trend judgment.
  2. Optimize parameters: Use genetic algorithms, grid search and other methods to optimize the parameters of the strategy to find the optimal parameter combination and improve the performance of the strategy.
  3. Add stop-loss measures: Add some stop-loss measures, such as fixed stop-loss, trailing stop-loss, etc., to control the drawdown risk of the strategy.
  4. Combine multiple timeframes: Consider running the strategy on different timeframes, using higher timeframes to determine the major trend and lower timeframes to determine entry points, thus improving the stability and profitability of the strategy.

Summary

This strategy combines the MACD indicator and EMA indicator to determine market trends, and uses the buy and sell signals of the Lux Algo SMC indicator to determine entry points, profiting from trending markets and avoiding frequent trading in rangebound markets. The strategy has obvious advantages, concise code, adjustable parameters, but also has some risks, such as parameter sensitivity, trend misjudgment, sudden event risk, etc. To further improve the performance of the strategy, we can consider introducing more indicators, optimizing parameters, adding stop-loss measures, combining multiple timeframes and other methods. Overall, this strategy is a promising quantitative trading strategy that deserves further research and optimization.


/*backtest
start: 2023-03-13 00:00:00
end: 2024-03-18 00:00:00
period: 1d
basePeriod: 1h
exchanges: [{"eid":"Futures_Binance","currency":"BTC_USDT"}]
*/

//@version=5
strategy("SMC with MACD and EMA", overlay=true)

// 1. MACD Settings
fastLength = input(12, title="MACD Fast Length")
slowLength = input(26, title="MACD Slow Length")
signalLength = input(9, title="MACD Signal Length")

// 2. EMA Settings
emaLength = input(200, title="EMA Length")

// 3. Calculating MACD and assigning variables correctly
[macdLine, signalLine, hist] = ta.macd(close, fastLength, slowLength, signalLength)

// 4. EMA Calculation
emaValue = ta.ema(close, emaLength)

// 5. Get Buy/Sell Signals from Lux Algo SMC Indicator (Modify as needed)
buySignal = input.bool(true, title="Buy Signal from Lux Algo SMC") 
sellSignal = input.bool(true, title="Sell Signal from Lux Algo SMC")

// 6. Strategy Logic (Using the corrected variables)
if buySignal and macdLine > signalLine and close > emaValue 
    strategy.entry("Buy", strategy.long)

if sellSignal and macdLine < signalLine and close < emaValue 
    strategy.entry("Sell", strategy.short)

// 7. Optional: Plot MACD for visualization 
plot(macdLine, color=color.blue, title="MACD")
plot(signalLine, color=color.orange, title="Signal")
template: strategy.tpl:40:21: executing "strategy.tpl" at <.api.GetStrategyListByName>: wrong number of args for GetStrategyListByName: want 7 got 6