Automatic Forecasting Long/Short Target Stop Loss Strategy Based on 9:15 High/Low

Overview
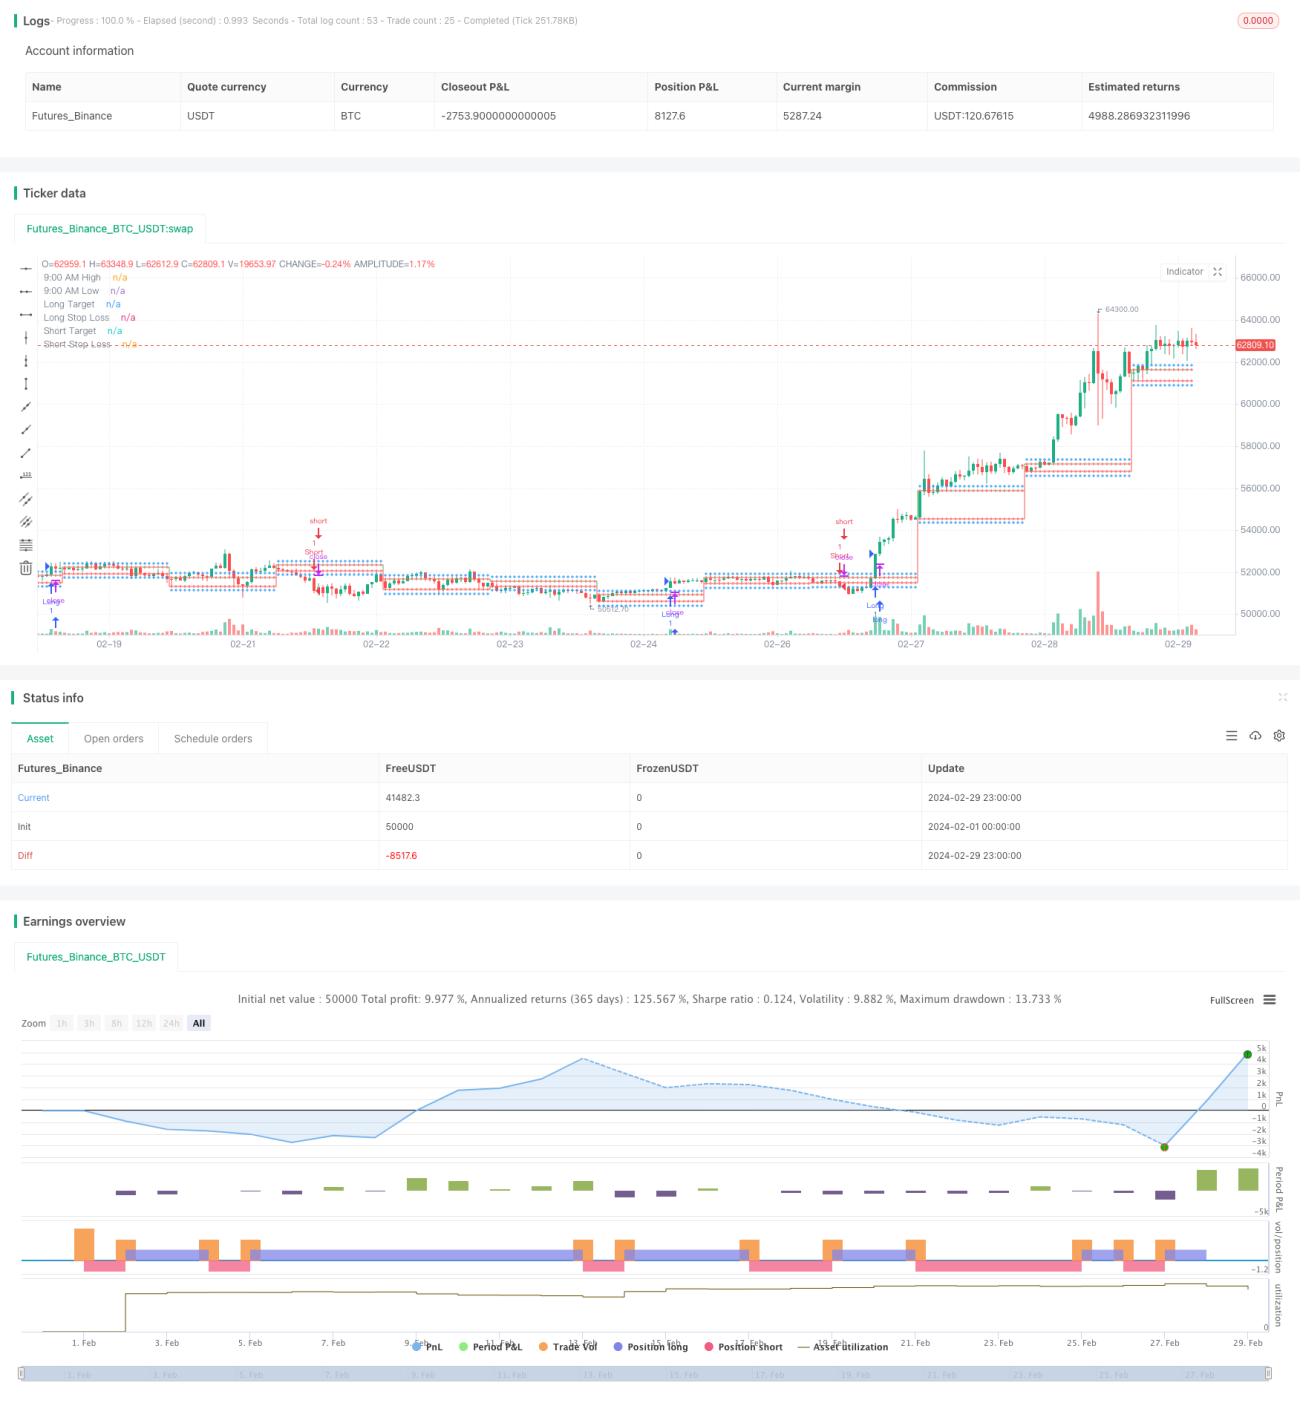
This strategy automatically calculates long and short target prices and stop loss levels based on the high and low of the 9:15 minute candle. It uses the RSI indicator to determine the current overbought or oversold state of the market and triggers a long or short entry when the price breaks the 9:15 high/low and the RSI condition is met. The strategy simplifies the trading process by automatically predicting target prices and stop loss levels for long and short directions.
Strategy Principle
- Determine the high and low of the 9:15 minute candle as key levels for long and short directions.
- Long direction: target price is 9:15 high + 200 points, stop loss is 9:15 low.
- Short direction: target price is 9:15 low - 200 points, stop loss is 9:15 high.
- Calculate the RSI indicator with default parameters of 14, overbought line at 60, and oversold line at 40.
- Long entry condition: close price breaks above 9:15 high and RSI is greater than the overbought line.
- Short entry condition: close price breaks below 9:15 low and RSI is less than the oversold line.
- Execute the corresponding long or short entry when the entry conditions are met.
- Plot the 9:15 high/low, long/short target prices, stop loss levels, and entry signals on the chart.
The strategy utilizes the high and low of the 9:15 minute candle as key levels and automatically calculates the target prices and stop losses for long and short directions, simplifying the trader's operation. Additionally, it introduces the RSI indicator as a filter condition, which can help avoid frequent entries and false breakouts to a certain extent.
Advantage Analysis
-
Automatic calculation of long/short targets and stop losses: The strategy automatically calculates the target prices and stop loss levels for long and short directions based on the 9:15 high/low. Traders do not need to set them manually, simplifying the operation process and improving trading efficiency.
-
RSI indicator filter: The strategy introduces the RSI indicator as a filter condition for entry. When the price breaks a key level, the RSI needs to reach the overbought or oversold state to trigger an entry signal. This can help traders avoid frequent trading and false breakout traps to a certain extent.
-
Intuitive chart display: The strategy plots the 9:15 high/low, long/short target prices, stop loss levels, and entry signals on the chart. Traders can intuitively see the key levels and trading signals, facilitating their decision-making.
-
Suitable for short-term trading: The strategy is based on the high and low of the 9:15 minute candle, and the target prices and stop losses are set relatively close. Therefore, it is more suitable for short-term trading operations, allowing for quick entries and exits to capture short-term price movements.
Risk Analysis
-
Intraday volatility risk: The strategy uses the 9:15 high/low as key levels, but prices may experience significant fluctuations during the trading day. If the price quickly reverses after triggering an entry, it may cause the trader's loss to exceed expectations.
-
Stop loss level risk: The stop loss levels in the strategy are fixed, with the long stop loss at the 9:15 low and the short stop loss at the 9:15 high. If the price continues to move significantly after breaking the 9:15 high/low, the fixed stop loss levels may result in larger losses.
-
RSI indicator parameter risk: The strategy uses default RSI parameters, with a length of 14, overbought line at 60, and oversold line at 40. However, these parameters may not be suitable for different market environments and instruments. Fixed parameter settings may affect the effectiveness of the strategy.
-
Risk-reward ratio risk: The fixed target prices and stop loss levels in the strategy determine the risk-reward ratio of each trade. If the risk-reward ratio is not set appropriately, it may lead to poor long-term profitability of the strategy.
Solutions:
- For intraday volatility risk, consider introducing more filter conditions, such as volume indicators or narrowing the stop loss range.
- For stop loss level risk, consider using trailing stop losses or conditional stop losses to dynamically adjust the stop loss levels based on market conditions.
- For RSI indicator parameter risk, optimize the parameters for different markets and instruments to find more suitable combinations.
- For risk-reward ratio risk, test different target price and stop loss combinations based on historical data to find more optimal risk-reward ratio settings.
Optimization Directions
-
Dynamic stop loss: The current strategy uses fixed stop loss levels. Consider introducing dynamic stop loss mechanisms, such as trailing stop losses or conditional stop losses. This allows for timely risk control when prices experience unexpected volatility.
-
Introducing more filter conditions: The strategy currently relies mainly on price breakouts and the RSI indicator. Consider adding more filter conditions, such as volume indicators or volatility indicators. By confirming entry signals through multiple conditions, the effectiveness of the signals can be improved.
-
Parameter optimization: Optimize the RSI indicator parameters for different markets and instruments. By testing historical data, find parameter combinations that are more suitable for the current trading instrument to improve the stability of the strategy.
-
Risk-reward ratio optimization: The risk-reward ratio has a significant impact on long-term profitability. By backtesting historical data, test different target price and stop loss combinations to find risk-reward ratio settings that can generate higher returns.
-
Incorporating trend analysis: The current strategy mainly relies on intraday high/low breakouts, which is a counter-trend approach. Consider incorporating trend analysis to trade in the direction of the larger trend, improving the win rate and risk-reward ratio.
Conclusion
This strategy automatically calculates long and short target prices and stop loss levels based on the 9:15 high/low, while using the RSI indicator as a filter condition, simplifying the trader's operation process. The advantages of the strategy lie in its high degree of automation, intuitive usability, and suitability for short-term trading operations. However, it also involves certain risks, such as intraday volatility risk, stop loss level risk, indicator parameter risk, and risk-reward ratio risk. To address these risks, the strategy can be improved through dynamic stop losses, introducing more filter conditions, parameter optimization, risk-reward ratio optimization, and trend analysis. By continuously optimizing and improving the strategy, its stability and profitability can be enhanced to better adapt to different market environments.
- 1