Bollinger Bands + EMA Trend Following Strategy

Overview
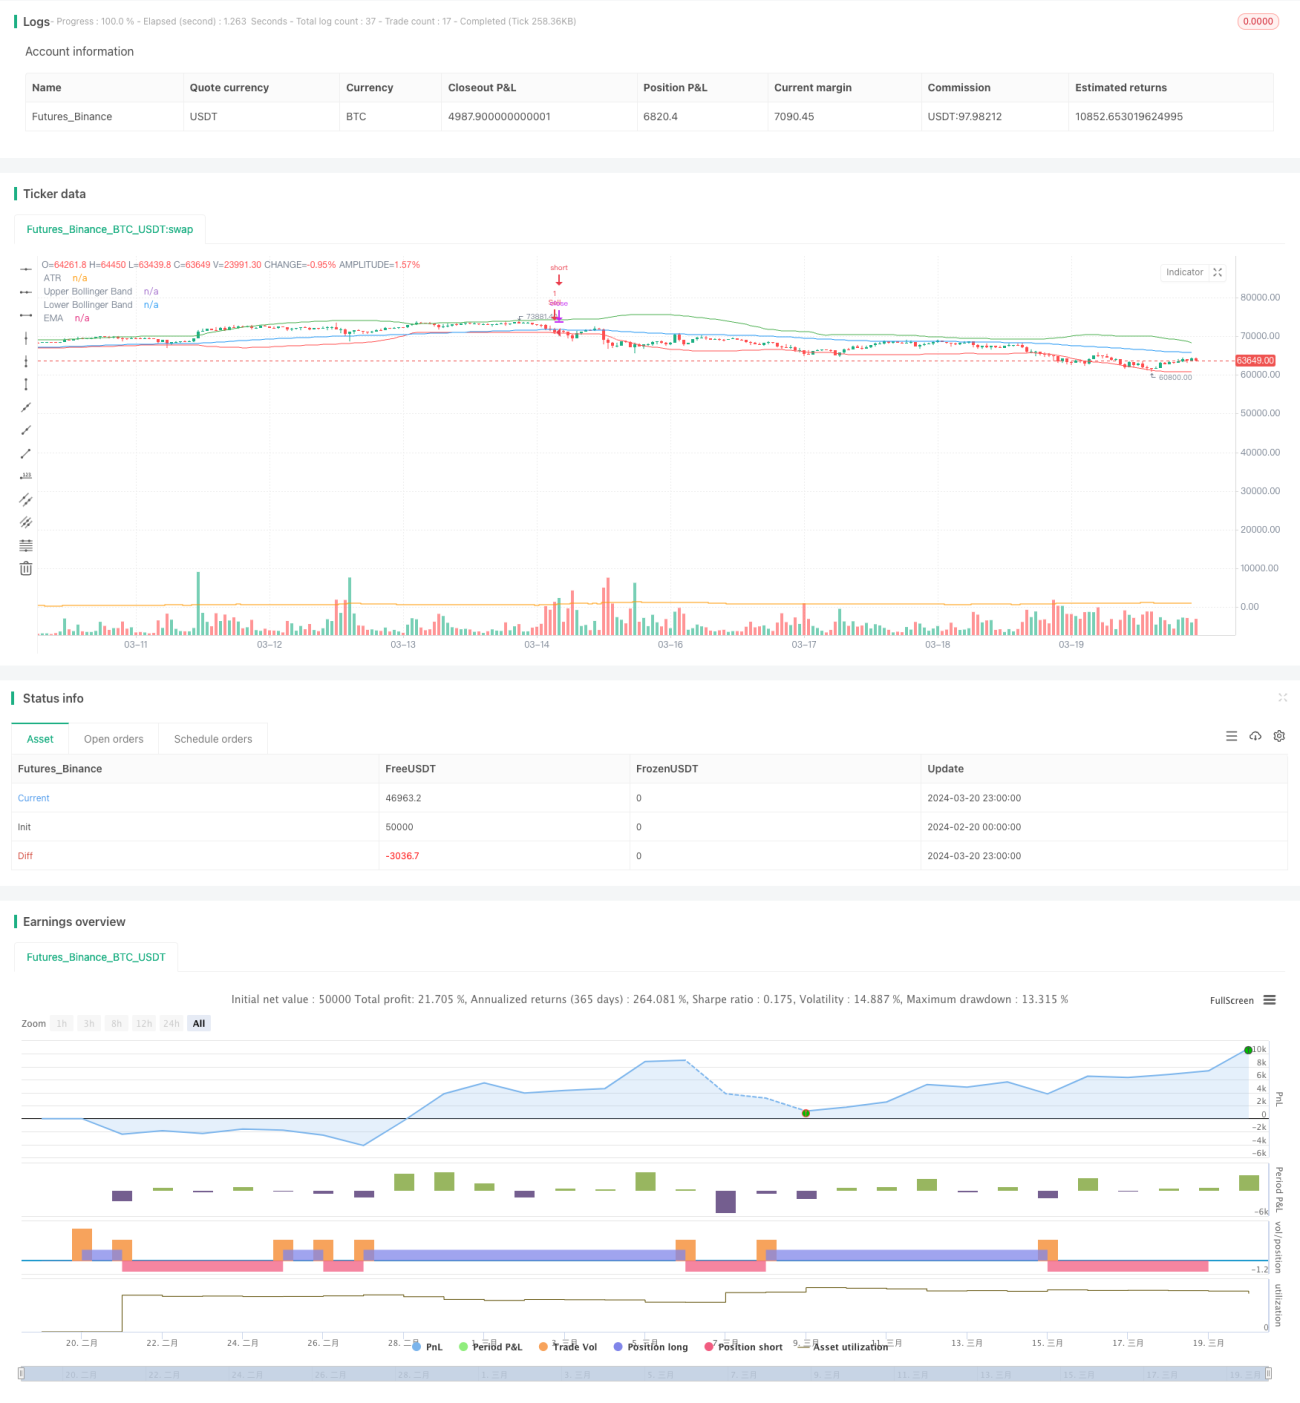
This strategy combines two technical indicators, Bollinger Bands and Exponential Moving Average (EMA), to capture trending opportunities in the market. The main idea behind the strategy is to use Bollinger Bands to determine whether the price is at a relatively high or low level, while using EMA as a trend filter. The strategy makes trading decisions based on a set of logical rules.
Strategy Principles
-
Calculate Bollinger Bands: Compute the Simple Moving Average (SMA) and standard deviation of the closing prices to obtain the upper and lower bands of the Bollinger Bands. The upper band is the SMA plus a certain multiple of the standard deviation, while the lower band is the SMA minus a certain multiple of the standard deviation.
-
Calculate EMA: Calculate the Exponential Moving Average of the closing prices based on the specified EMA period.
-
Calculate ATR: Calculate the Average True Range (ATR) based on the specified ATR period.
-
Buy Condition: A buy signal is triggered when the closing price is above both the EMA and the upper Bollinger Band.
-
Sell Condition: A sell signal is triggered when the closing price crosses below the lower Bollinger Band or the EMA.
-
Execute Trades: Execute long or short trades based on the buy and sell conditions.
-
Plotting: Plot the EMA and Bollinger Bands on the main chart, and plot the ATR on a separate pane.
Advantage Analysis
-
Bollinger Bands are effective in capturing the price volatility range, helping to determine whether the price is at a relatively high or low level.
-
EMA can reflect the trend direction of the price and can be used to filter trading signals generated by Bollinger Bands, improving the accuracy of trades.
-
ATR can measure market volatility and provide a reference for trading decisions.
-
The strategy logic is clear and easy to understand and implement.
-
By adjusting the parameters of Bollinger Bands and EMA, the strategy can adapt to different market environments and trading instruments.
Risk Analysis
-
In a sideways market or during trend reversals, the strategy may generate numerous false signals, leading to frequent trades and losses.
-
The strategy is sensitive to parameter selection, and different parameter settings may lead to different trading results.
-
The strategy does not consider trading costs and slippage, which may impact the strategy's profitability in actual trading.
-
The strategy lacks risk management measures, such as stop-loss and position sizing.
Optimization Directions
-
Introduce trend confirmation indicators, such as MACD or DMI, to further validate the reliability of the trend and reduce false signals.
-
Optimize parameter selection by testing different parameter combinations on historical data to find the optimal settings.
-
Incorporate risk management measures, such as setting dynamic stop-losses based on ATR or adjusting position sizes based on market volatility.
-
Consider the impact of trading costs and slippage in backtesting and live trading to improve the practicality of the strategy.
-
Combine other technical indicators or fundamental factors to construct a more comprehensive and robust trading strategy.
Conclusion
The Bollinger Bands + EMA Trend Following Strategy combines two technical indicators, Bollinger Bands and EMA, to capture trending opportunities in the market. The strategy's advantages lie in its clear logic, ease of understanding and implementation, and the ability to adapt to different market environments by adjusting parameters. However, the strategy also has some risks, such as generating numerous false signals in sideways markets or during trend reversals, being sensitive to parameter selection, and lacking risk management measures. To further optimize the strategy, one can consider introducing other trend confirmation indicators, optimizing parameter selection, incorporating risk management measures, considering trading costs and slippage, and combining other technical indicators or fundamental factors. Overall, the strategy provides a basic framework for trend trading, but in practical application, it needs to be optimized and improved based on specific situations to enhance the strategy's robustness and profitability.
- 1