ATR Trend Breakout Strategy

Overview
This is a quantitative trading strategy that captures trend breakouts using the ATR indicator and closing prices. The strategy dynamically calculates upper and lower trend lines to determine the trend direction and generates trading signals when the closing price breaks through the trend lines. The strategy also sets stop-loss and target price levels and allows for trailing stops based on volatility.
Strategy Principles
- Calculate ATR signal: atr_signal = atr(atr_period)
- Calculate upper and lower trend lines:
- Lower trend line: lower_trend = low - atr_mult*atr_signal
- Upper trend line: upper_trend = high + atr_mult*atr_signal
- Dynamically adjust trend lines, keeping them unchanged if they are broken, otherwise updating to the latest values
- Color-code the trend lines based on the relative position of the closing price to identify trend direction
- Generate trading signals:
- Long signal: No current position and closing price breaks above the upper trend line
- Short signal: No current position and closing price breaks below the lower trend line
- Set stop-loss and target prices:
- Stop-loss: Latest entry price ± ATR range * factor at the time of breakout
- Target price: Latest entry price ± stop-loss range * reward/risk ratio (rr)
- Trailing stop:
- Long stop: Highest upper trend line
- Short stop: Lowest lower trend line
Advantages Analysis
- Dynamically adjusts trend lines based on volatility to adapt to different market conditions
- Color-coded trend lines with directionality for easy trend identification
- Uses ATR as a volatility measure to set reasonable stop-loss and target prices
- Trailing stop functionality to lock in profits while minimizing drawdowns
- Highly parameterized to suit different instruments and timeframes
Risk Analysis
- Trend breakout strategies can generate excessive signals leading to losses in choppy markets
- Improper selection of ATR parameters may result in overly sensitive or sluggish trend lines, affecting signal quality
- Fixed reward/risk ratio may not adapt well to different market characteristics
- Trailing stops may cut losses and miss out on trend moves
Solutions:
- Introduce trend filters or oscillator indicators to avoid losses in ranging markets
- Optimize ATR parameters separately based on instrument and timeframe characteristics
- Optimize reward/risk ratio and trailing stop logic to improve strategy risk-adjusted returns
- Combine with trend recognition methods to improve trailing stops and capture more trend profits
Optimization Directions
- Combine multiple timeframes, using higher timeframes to identify trends and lower timeframes to trigger signals
- Add volume and price indicators for validation before trend line breakouts to improve signal validity
- Optimize position sizing and incorporate swing trading
- Perform parameter optimization for stop-loss and reward/risk ratio
- Improve trailing stop logic to reduce premature stops during trend moves
Multi-timeframe analysis helps filter out noise for more stable trend identification. Volume and price confirmation before breakouts can eliminate false signals. Position sizing optimization improves capital efficiency. Optimizing stop-loss and reward/risk parameters can enhance risk-adjusted returns. Refining trailing stop logic allows capturing more trend profits while controlling drawdowns.
Summary
This strategy uses ATR as a volatility gauge to dynamically adjust trend line positions and capture trend breakouts. It sets reasonable stop-losses and profit targets, employing trailing stops to lock in gains. The parameters are adjustable for strong adaptability. However, trend breakout strategies are susceptible to whipsaw losses in choppy conditions and require further optimization and refinement. Combining multiple timeframes, filtering signals, optimizing position sizing, parameter optimization, and other techniques can improve the strategy's performance and robustness. Quantitative strategies demand continuous testing and optimization based on a solid understanding of the underlying principles in order to provide aspiring traders with more ideas and guidance.
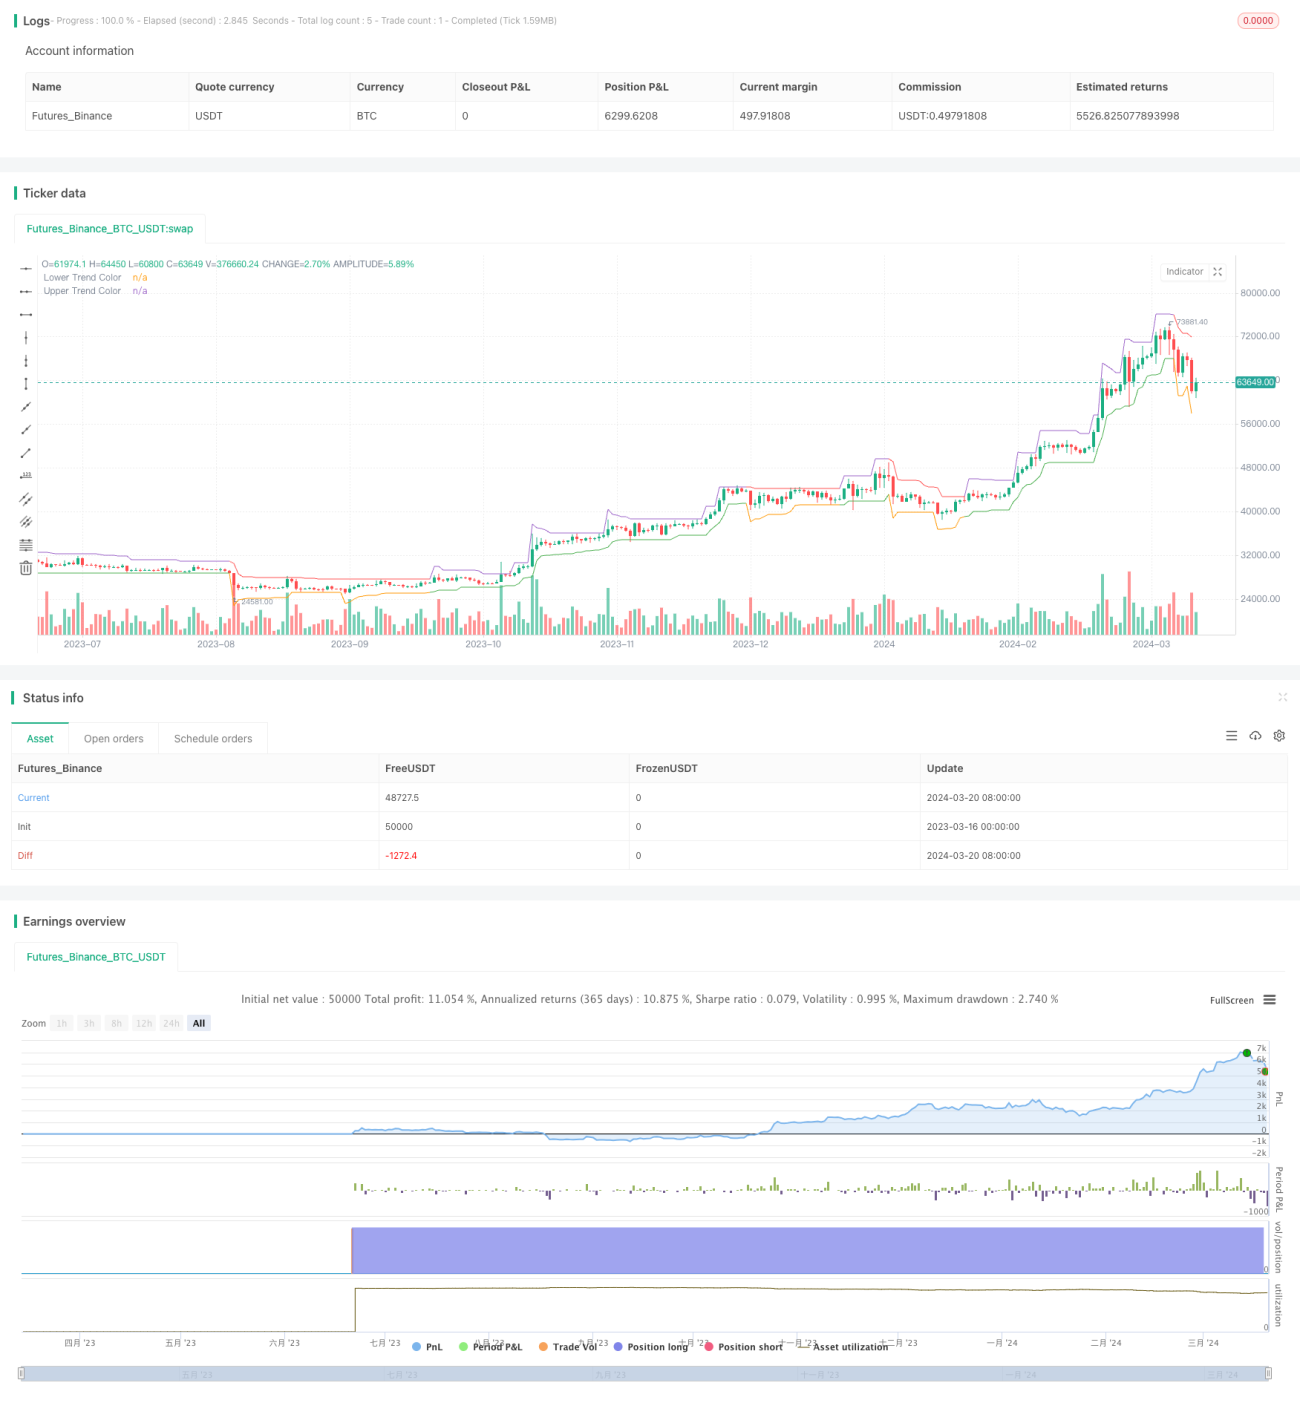
/*backtest
start: 2023-03-16 00:00:00
end: 2024-03-21 00:00:00
period: 1d
basePeriod: 1h
exchanges: [{"eid":"Futures_Binance","currency":"BTC_USDT"}]
*/

//@version=4
strategy(title = "Claw-Pattern", overlay=true, calc_on_every_tick=true, default_qty_type= strategy.percent_of_equity,default_qty_value=10, currency="USD")
//Developer: Trading Strategy Guides
//Creator: Trading Strategy Guides- 1