High-Frequency Cryptocurrency Trading Strategy Combining TrippleMACD Crossover and Relative Strength Index

Overview
This article introduces a high-frequency cryptocurrency trading strategy that combines TrippleMACD crossover with the Relative Strength Index (RSI). The strategy employs three sets of MACD indicators with different parameters and averages their signal lines, while also incorporating the RSI indicator to determine optimal buy and sell timings. The strategy is designed for automated trading on a 1-minute timeframe, considering only long trades. Additionally, the strategy utilizes linear regression to identify consolidation phases in the market, avoiding trades during choppy market conditions.
Strategy Principle
The core of this strategy is to utilize three sets of MACD indicators with different parameters to capture trend signals on various time scales. By averaging the signal lines of these three MACD indicators, noise can be effectively smoothed out, providing more reliable trading signals. At the same time, the RSI indicator is used to confirm the strength of bullish trends. The strategy generates a buy signal only when all three MACD indicators show bullish signals and the RSI indicator also confirms the strength of the bullish trend.
Furthermore, the strategy employs linear regression to identify consolidation phases in the market. By calculating the ratio of the upper and lower shadow lengths to the body length of candles, it can be determined whether the current market is in a consolidation state. If the length of the upper and lower shadows is more than twice the length of the body, the market is considered to be in a consolidation phase, and the strategy will avoid trading during this time.
Advantage Analysis
-
Multi-timeframe analysis: By using three sets of MACD indicators with different parameters, the strategy can capture trend signals on various time scales, improving the accuracy and reliability of trades.
-
Signal smoothing: Averaging the signal lines of the three MACD indicators effectively smooths out noise, avoiding misleading signals that may be generated by a single indicator.
-
Trend confirmation: Incorporating the RSI indicator to confirm the strength of bullish trends further enhances the reliability of trading signals.
-
Consolidation identification: Utilizing linear regression to identify consolidation phases in the market allows the strategy to avoid trading during choppy market conditions, reducing the strategy's risk.
-
Automated trading: The strategy is designed for automated trading on a 1-minute timeframe, enabling quick responses to market changes and efficient trade execution.
Risk Analysis
-
Parameter optimization: The strategy involves multiple parameters, such as the fast and slow line periods of the three MACD indicators and the period of the RSI indicator. The selection of these parameters has a significant impact on the strategy's performance. If the parameters are not optimized properly, the strategy's performance may decline.
-
Overfitting risk: The strategy may perform well on specific historical data but may fail to adapt to market changes in actual application, leading to strategy failure.
-
Black swan events: The strategy primarily relies on technical indicators and may not adequately respond to significant fundamental events, which could lead to poor performance in extreme market conditions.
Optimization Direction
-
Dynamic parameter adjustment: Dynamically adjust the parameters in the strategy, such as the fast and slow line periods of the MACD indicators and the period of the RSI indicator, based on changes in market conditions to adapt to different market environments.
-
Incorporate additional indicators: In addition to the existing MACD and RSI indicators, consider incorporating other technical indicators, such as Bollinger Bands and moving averages, to further improve the accuracy and reliability of trading signals.
-
Risk management optimization: Implement more comprehensive risk management measures in the strategy, such as dynamic stop-loss and position management, to reduce the overall risk of the strategy.
-
Machine learning optimization: Utilize machine learning algorithms, such as neural networks and support vector machines, to optimize the strategy's parameters and trading rules, enhancing the adaptability and robustness of the strategy.
Conclusion
This article introduces a high-frequency cryptocurrency trading strategy that combines TrippleMACD crossover with the RSI indicator. The strategy employs three sets of MACD indicators with different parameters and the RSI indicator to generate reliable trading signals while utilizing linear regression to identify consolidation phases in the market, avoiding trades during choppy market conditions. The strategy's advantages lie in multi-timeframe analysis, signal smoothing, trend confirmation, consolidation identification, and automated trading. However, it also faces risks such as parameter optimization, overfitting, and black swan events. In the future, the strategy can be improved through dynamic parameter adjustment, incorporating additional indicators, risk management optimization, and machine learning optimization to enhance its adaptability and robustness, better coping with changes in the cryptocurrency market.
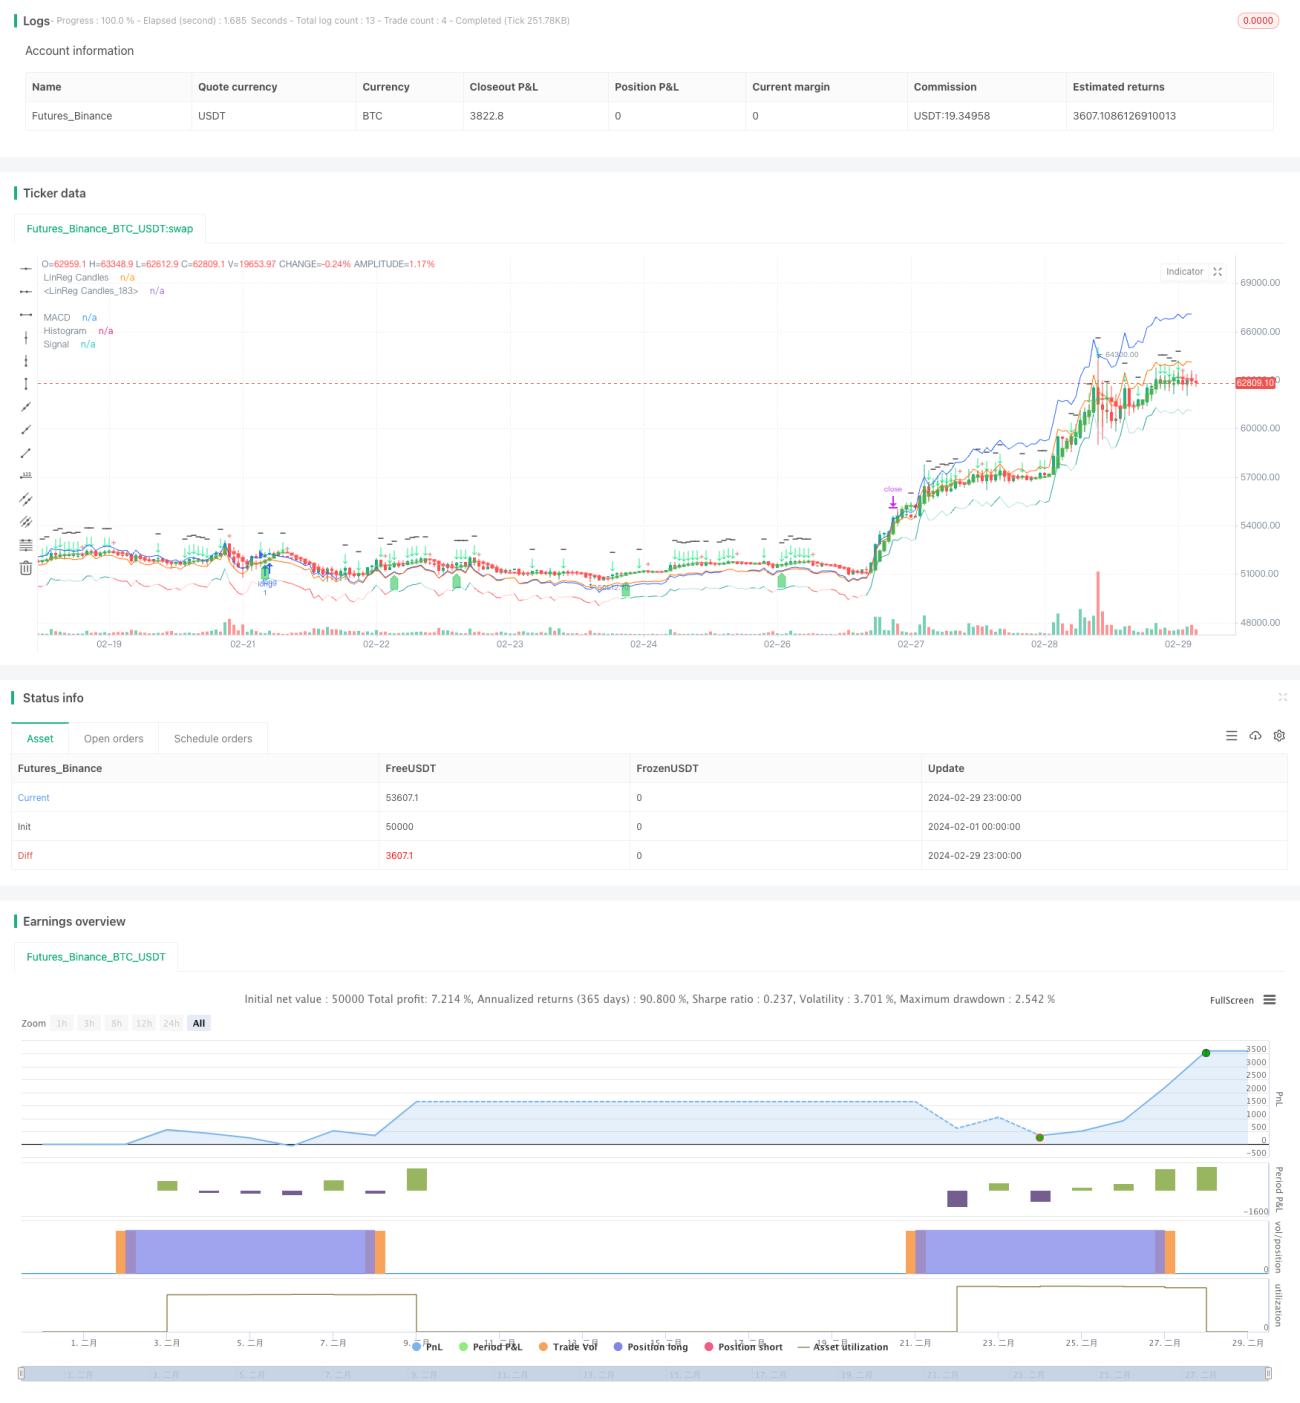
/*backtest
start: 2024-02-01 00:00:00
end: 2024-02-29 23:59:59
period: 1h
basePeriod: 15m
exchanges: [{"eid":"Futures_Binance","currency":"BTC_USDT"}]
*/

//@version=5
//indicator("Triplle",shorttitle="Triplle MACD", overlay=true, scale = scale.none)
//indicator("Triplle","TrippleMACD",true)
strategy(title="TrippleMACD", shorttitle="TrippleMACD + RSI strategy", format=format.price, precision=4, overlay=true)- 1