Bollinger Band Dynamic Take Profit and Dynamic Position Adding Strategy

Strategy Overview
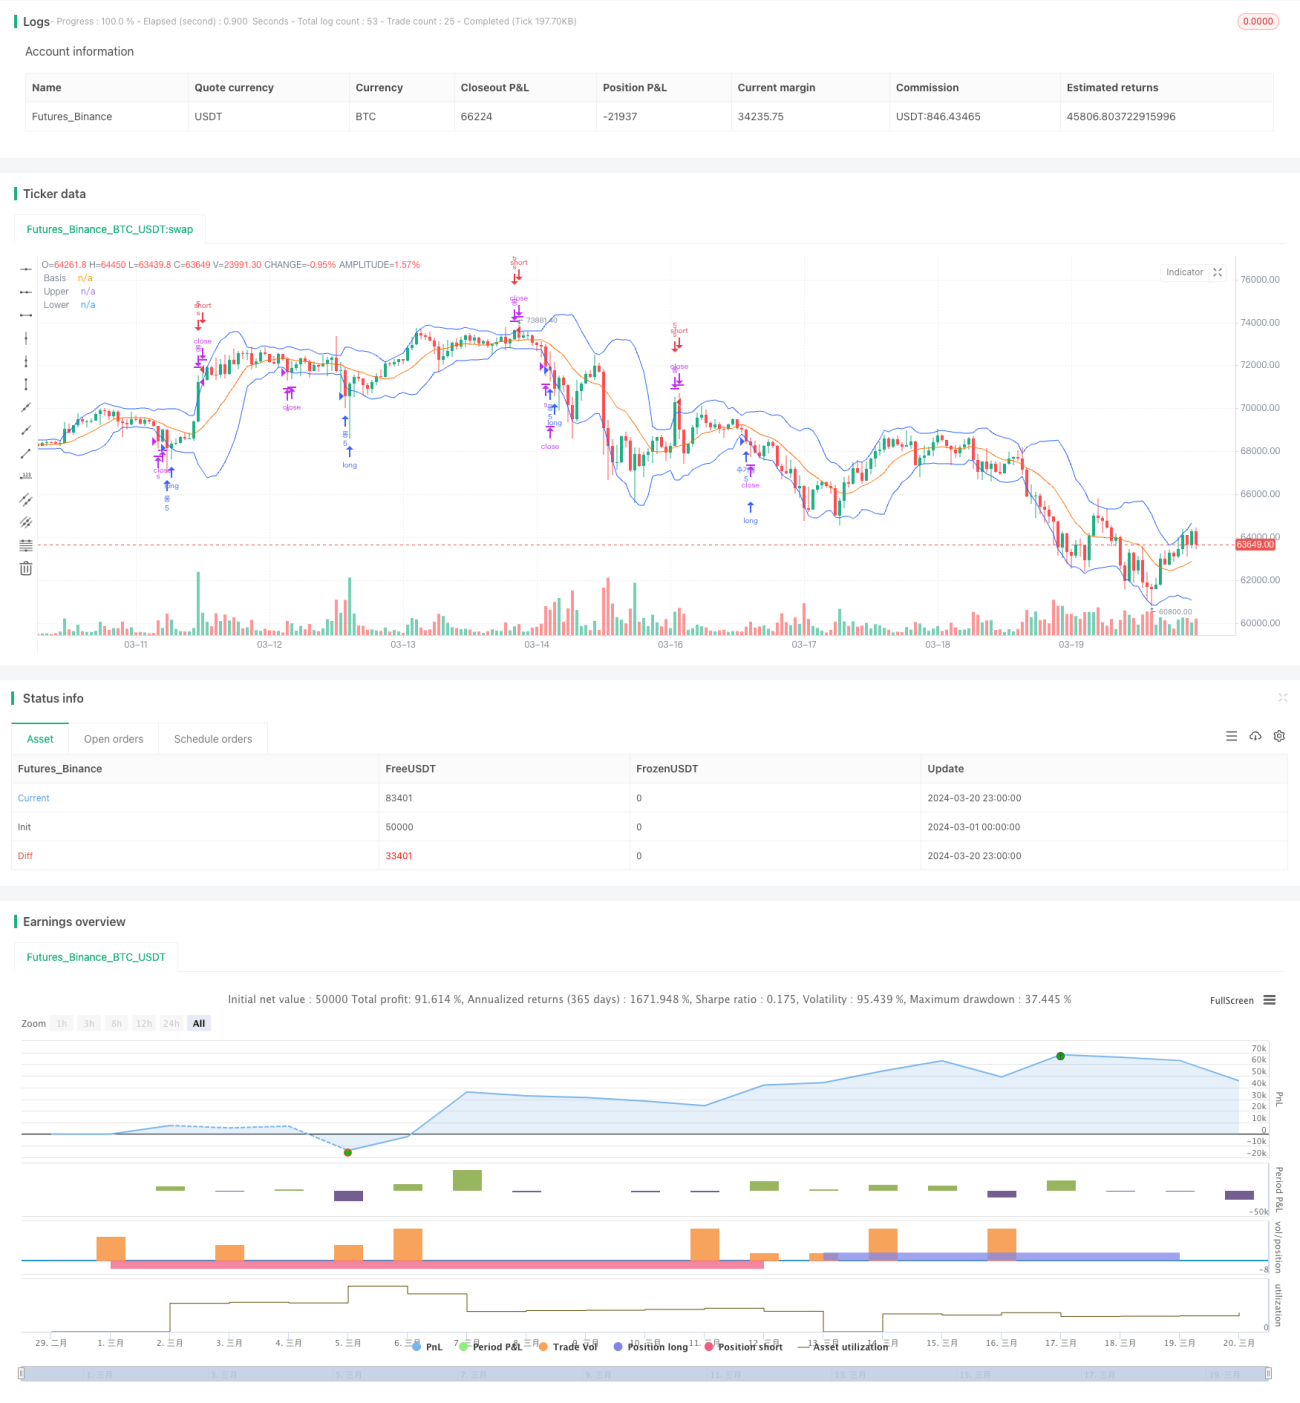
This strategy is based on the Bollinger Band indicator. It opens positions when the price reaches the upper or lower band, and sets up dynamic take profit and dynamic position adding logic. When the price rebounds from the lower band and breaks through the middle band, the strategy considers an uptrend has formed. At this time, the strategy will add positions when the price pulls back to a certain percentage of the middle band. When the price finally breaks through the upper band, the strategy closes positions to take profits. In a downtrend, the strategy adopts the opposite operating logic. Through dynamic take profit and dynamic position adding based on Bollinger Bands, this strategy can obtain more profits in trending markets.
Strategy Principle
The main principles of this strategy are as follows:
-
Calculate the upper, middle and lower bands of Bollinger Bands. The upper and lower bands are calculated by adding and subtracting N times the standard deviation from the middle band, where N can be customized.
-
When the closing price breaks down the lower band and no position has been opened before, the strategy opens a long position; when the closing price breaks up the upper band and no position has been opened before, the strategy opens a short position. The opening logic here is similar to the traditional Bollinger Band breakout system.
-
After opening a long position, if the closing price breaks upward through the middle band, it is considered that an uptrend has formed, and the variable basisCrossed is marked as true. After opening a short position, if the closing price breaks downward through the middle band, basisCrossed is also marked as true.
-
In the case of a long position, if the closing price breaks down the lower band and basisCrossed is true, and the current price has fallen by more than 2% from the original opening price, the strategy adds positions at this time, and resets basisCrossed to false at the same time. The case of a short position is the opposite. The position adding logic here allows the strategy to add positions at a low level during a trend pullback, increasing the profit space.
-
If the closing price breaks through the upper band when holding a long position, or the closing price breaks down the lower band when holding a short position, the strategy closes all positions, takes profits, and resets various marker variables to prepare for the next opening.
Through the above dynamic opening, adding positions and taking profit logic, this strategy can flexibly operate in trending markets to gain higher profits. At the same time, using the classic technical indicator of Bollinger Bands to capture trends also gives the strategy a certain adaptability and stability.
Advantage Analysis
-
Dynamic take profit: This strategy dynamically adjusts the take profit level through the upper and lower bands of Bollinger Bands. Compared with fixed point take profit, it can better adapt to market fluctuations and flexibly protect profits.
-
Dynamic position adding: In the pullback stage after the trend is formed, the strategy will gradually add positions, which can gain higher profits in trending markets. Dynamic position adding makes this strategy more advantageous in trend trading.
-
Flexible parameters: The parameters of Bollinger Bands, such as N and P values, can be flexibly adjusted to adapt to different market characteristics and trading styles.
-
Strong adaptability: Bollinger Band is a classic technical indicator with a good ability to capture trends. Combining it with dynamic position management, it can play a stable role in various financial markets.
-
Clear logic: The opening and closing conditions and the logic of adding and reducing positions of this strategy are very clear and easy to understand, which is convenient for traders to understand and control. Clear logic also means it is easier to do secondary development and strategy optimization.
Risk Analysis
-
Oscillating market: Bollinger Band strategies often perform poorly in oscillating markets. At this time, frequent opening and closing of positions will lead to more transaction costs, which will affect the overall return.
-
Trend reversal: At the key moment of trend reversal, this strategy may experience lagging judgment, leading to adding positions in the wrong direction, resulting in a larger drawdown.
-
Extreme situations: In extreme situations (such as sharp rises and falls), the trend of Bollinger Bands may be abnormal, causing the strategy to fail.
-
Parameter settings: Inappropriate parameter settings will seriously affect the performance of this strategy. For example, setting the N value too small will lead to frequent transactions, and setting the N value too large will lead to signal lag.
-
Black swan events: If there are major political and economic events, this strategy may face greater risk exposure.
In order to control the above risks, we can start from two aspects: 1) Reasonably set parameters and optimize parameters for different targets and market conditions; 2) Add more filtering conditions to the strategy, such as trend judgment, volatility filtering, etc., to improve the quality of signals. In addition, in actual use, it is also necessary to do a good job in position control and risk management, and strictly control the risk exposure of a single transaction.
Optimization Direction
-
Trend filtering: Add the logic of trend judgment when opening positions, such as using MA bullish arrangement as a filtering condition for going long, and MA bearish arrangement as a filtering condition for going short, which can improve the success rate of trend grasping.
-
Volatility filtering: Bollinger Bands are actually a kind of volatility indicator. Volatility indicators such as ATR and historical volatility can be introduced to identify the volatility state of the market. Positions can be appropriately reduced in high-volatility states and increased in low-volatility states, so as to better control risks.
-
Dynamic parameter optimization: The parameters of Bollinger Bands can be dynamically adjusted according to market conditions. For example, the N value can be increased in trending markets and decreased in oscillating markets. This requires the use of machine learning and other technologies to find the optimal parameters through training on historical data.
-
Combined strategies: This strategy can be combined with other classic strategies such as MACD and RSI to form combined strategies, improving the robustness and profitability of the system.
-
Add stop-loss logic: At present, this strategy lacks a clear stop-loss logic. We can consider adding mechanisms such as trailing stop or fixed percentage stop-loss to control the maximum loss of a single transaction.
-
Position management optimization: In the process of adding and reducing positions, classic position management methods such as the Kelly formula and optimal F value can be used to maximize profits under controllable risks.
Through the above optimizations, the risk-reward ratio of this strategy can be further improved, enabling it to better adapt to changing market environments and bring stable returns to traders.
Summary
The Bollinger Band dynamic take profit and dynamic position adding strategy is a classic trend tracking strategy. Based on Bollinger Bands, it seeks higher trend profits by dynamically adjusting positions. This strategy has clear logic, flexible parameters, and strong adaptability. It is a quantitative trading strategy worthy of in-depth research and application. But at the same time, we must also see that this strategy performs poorly in oscillating markets and lacks the ability to deal with extreme situations and black swan events. This requires us to focus on parameter optimization, risk control and strategy combination in actual application, and regularly test the effectiveness of the strategy in different market conditions. By deeply understanding the internal logic of this strategy and continuously optimizing and improving it, I believe this strategy can become an important tool for quantitative traders and bring long-term and stable returns to investors.
- 1