概述
多空线性交叉策略是一种技术分析策略,基于线性回归模型预测股票未来价格走势。策略的基本原理是:股价走势往往遵循一定的线性趋势,通过计算价格的线性回归,可以预测未来价格。当预测价格上穿当前价格时做多,下穿时平仓。
策略原理
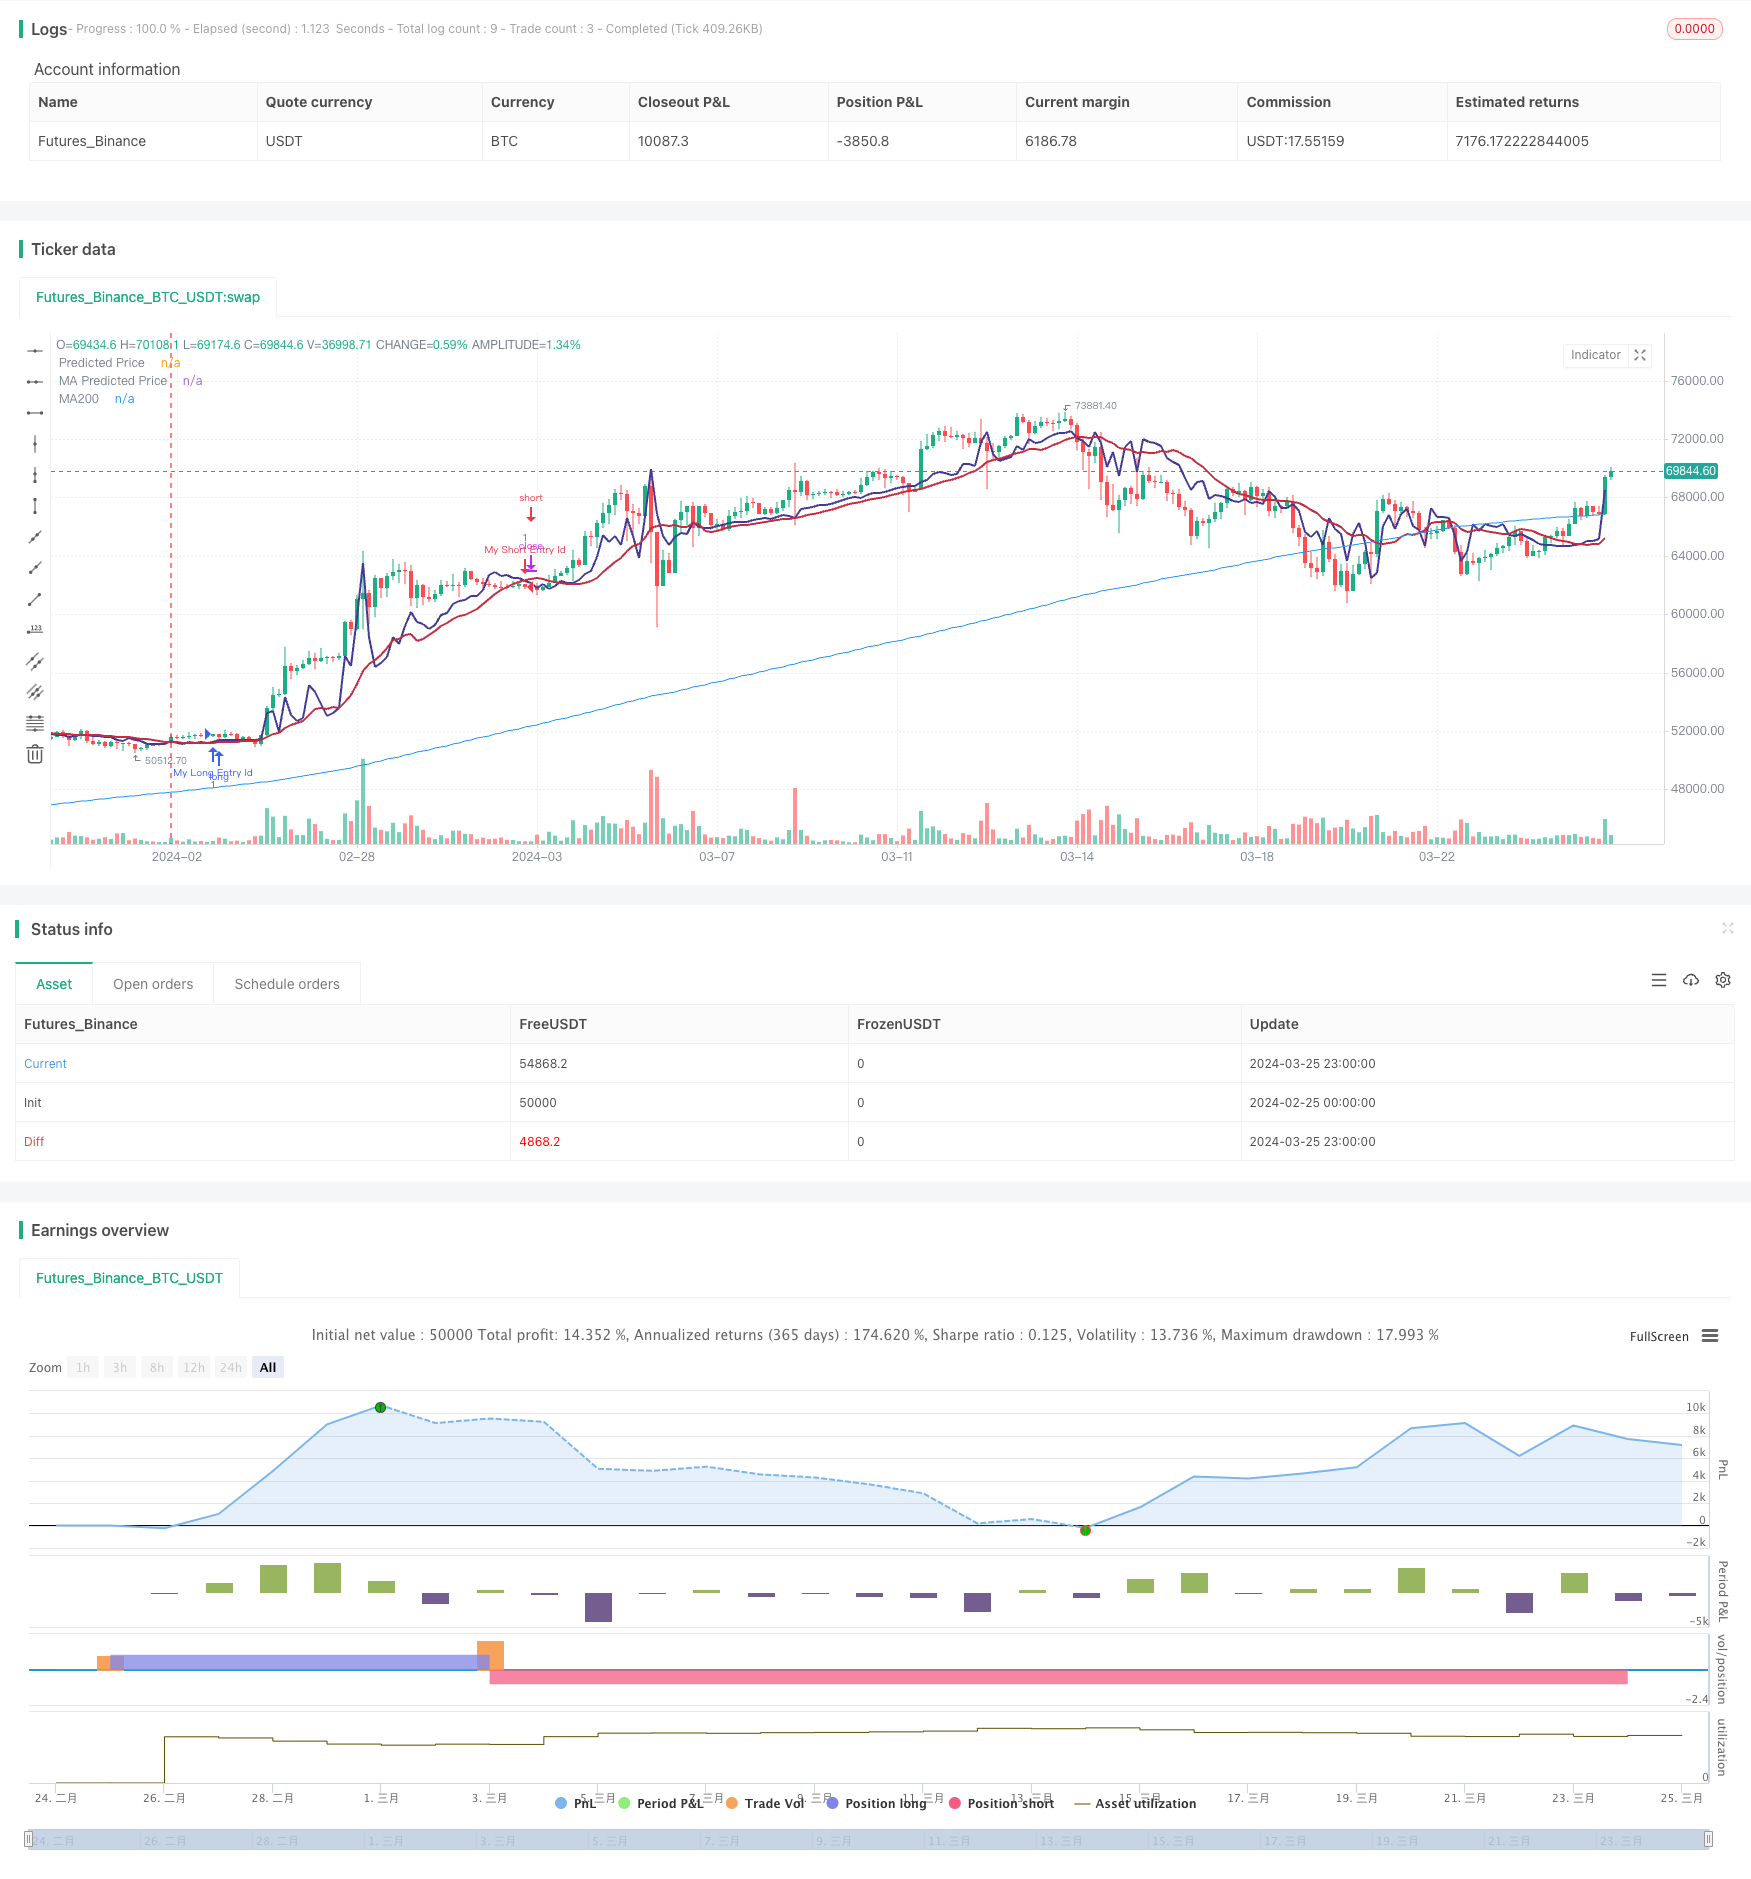
该策略首先计算一段时间内股价的线性回归。线性回归用最小二乘法拟合出一条直线,这条直线代表了价格随时间变化的趋势。策略然后在图表上绘制预测价格线和当前价格。
策略定义了两个信号:
- 做多信号:当预测价格上穿当前价格时触发
- 做空信号:当预测价格下穿当前价格时触发
当做多信号出现时,策略开仓做多;当做空信号出现时,平仓。
策略的关键步骤如下:
- 计算一段时间内价格的线性回归
- 在图表上画出预测价格线和当前价格
- 定义做多和做空信号
- 做多信号触发时开仓做多
- 做空信号触发时平仓
优势分析
多空线性交叉策略有以下优点:
- 简单有效:该策略逻辑清晰,易于实现,可以捕捉到价格的线性趋势。
- 适用性广:无论在趋势行情还是震荡行情,策略都能产生交易信号。
- 可优化性强:策略包含一些关键参数,如线性回归周期、移动平均线等,可以通过优化这些参数提高策略性能。
风险分析
尽管多空线性交叉策略有诸多优点,但它也存在一些风险:
- 趋势识别风险:当价格走势不遵循线性趋势时,例如震荡行情,策略可能会产生错误信号。可以通过结合其他指标如MACD等来降低风险。
- 参数设置风险:策略性能对参数设置较为敏感,不当的参数可能导致亏损。因此实盘前需要对参数做充分的回测和优化。
- 过拟合风险:如果对参数优化过度,可能导致策略过拟合历史数据,未来表现不佳。避免过拟合的方法包括保持简单、数据集外测试等。
优化方向
- 结合其他指标:线性回归信号可以与其他技术指标如MACD、布林带等结合,提高信号准确度。
- 动态参数优化:可以设计一套参数自适应机制,根据市场情况动态调整参数,提高适应性。
- 加入风控模块:在策略中加入止损、资金管理等风控措施,降低单次交易风险,提高累积收益。
- 机器学习优化:可以用机器学习算法不断优化线性回归模型,使其预测更加准确。
总结
多空线性交叉策略以价格线性回归为基础,通过比较预测价格和当前价格产生交易信号。该策略逻辑简单清晰,可以捕捉价格的线性趋势,适用于各类行情。同时,策略易于实现和优化,可以灵活调整参数,结合其他指标,加入风控模块等,不断提高策略性能。但策略也存在识别趋势不准、参数设置不当、过拟合历史数据等风险,实际运用时需谨慎。总的来说,多空线性交叉策略是一个简单有效的量化交易策略,值得进一步探索和优化。
策略源码
/*backtest
start: 2024-02-25 00:00:00
end: 2024-03-26 00:00:00
period: 3h
basePeriod: 15m
exchanges: [{"eid":"Futures_Binance","currency":"BTC_USDT"}]
*/

// This source code is subject to the terms of the Mozilla Public License 2.0 at https://mozilla.org/MPL/2.0/
// © stocktechbot
//@version=5
strategy("Linear Cross", overlay=true, margin_long=100, margin_short=0)

//Linear Regression

vol = volume

// Function to calculate linear regression
linregs(y, x, len) =>
    ybar = math.sum(y, len)/len
    xbar = math.sum(x, len)/len
    b = math.sum((x - xbar)*(y - ybar),len)/math.sum((x - xbar)*(x - xbar),len)
    a = ybar - b*xbar
    [a, b]

// Historical stock price data
price = close

// Length of linear regression
len = input(defval = 21, title = 'Strategy Length')
linearlen=input(defval = 9, title = 'Linear Lookback')
[a, b] = linregs(price, vol, len)

// Calculate linear regression for stock price based on volume
//eps = request.earnings(syminfo.ticker, earnings.actual)
//MA For double confirmation

out = ta.sma(close, 200)
outf = ta.sma(close, 50)
outn = ta.sma(close, 90)
outt = ta.sma(close, 21)
outthree = ta.sma(close, 9)

// Predicted stock price based on volume
predicted_price = a + b*vol

// Check if predicted price is between open and close
is_between = open < predicted_price and predicted_price < close

//MACD
//[macdLine, signalLine, histLine] = ta.macd(close, 12, 26, 9)

// Plot predicted stock price
plot(predicted_price, color=color.rgb(65, 59, 150), linewidth=2, title="Predicted Price")
plot(ta.sma(predicted_price,linearlen), color=color.rgb(199, 43, 64), linewidth=2, title="MA Predicted Price")
//offset = input.int(title="Offset", defval=0, minval=-500, maxval=500)
plot(out, color=color.blue, title="MA200")
[macdLine, signalLine, histLine] = ta.macd(predicted_price, 12, 26, 9)

//BUY Signal

longCondition=false
mafentry =ta.sma(close, 50) > ta.sma(close, 90)
//matentry = ta.sma(close, 21) > ta.sma(close, 50)
matwohun = close > ta.sma(close, 200)
twohunraise = ta.rising(out, 2)
twentyrise = ta.rising(outt, 2)
macdrise = ta.rising(macdLine,2)
macdlong = ta.crossover(predicted_price, ta.wma(predicted_price,linearlen))  and (signalLine < macdLine)
if macdlong and macdrise
    longCondition := true

if (longCondition)
    strategy.entry("My Long Entry Id", strategy.long)
//Sell Signal
lastEntryPrice = strategy.opentrades.entry_price(strategy.opentrades - 1)
daysSinceEntry = len
daysSinceEntry := int((time - strategy.opentrades.entry_time(strategy.opentrades - 1)) / (24 * 60 * 60 * 1000))
percentageChange = (close - lastEntryPrice) / lastEntryPrice * 100
//trailChange = (ta.highest(close,daysSinceEntry) - close) / close * 100

//label.new(bar_index, high, color=color.black, textcolor=color.white,text=str.tostring(int(trailChange)))
shortCondition=false
mafexit =ta.sma(close, 50) < ta.sma(close, 90)
matexit = ta.sma(close, 21) < ta.sma(close, 50)
matwohund = close < ta.sma(close, 200)
twohunfall = ta.falling(out, 3)
twentyfall = ta.falling(outt, 2)
shortmafall = ta.falling(outthree, 1)
macdfall = ta.falling(macdLine,1)
macdsell = macdLine < signalLine
if macdfall and macdsell and (macdLine < signalLine) and ta.falling(low,2)
    shortCondition := true

if (shortCondition)
    strategy.entry("My Short Entry Id", strategy.short)