EMA-Parabolic Trend Following Strategy

Overview
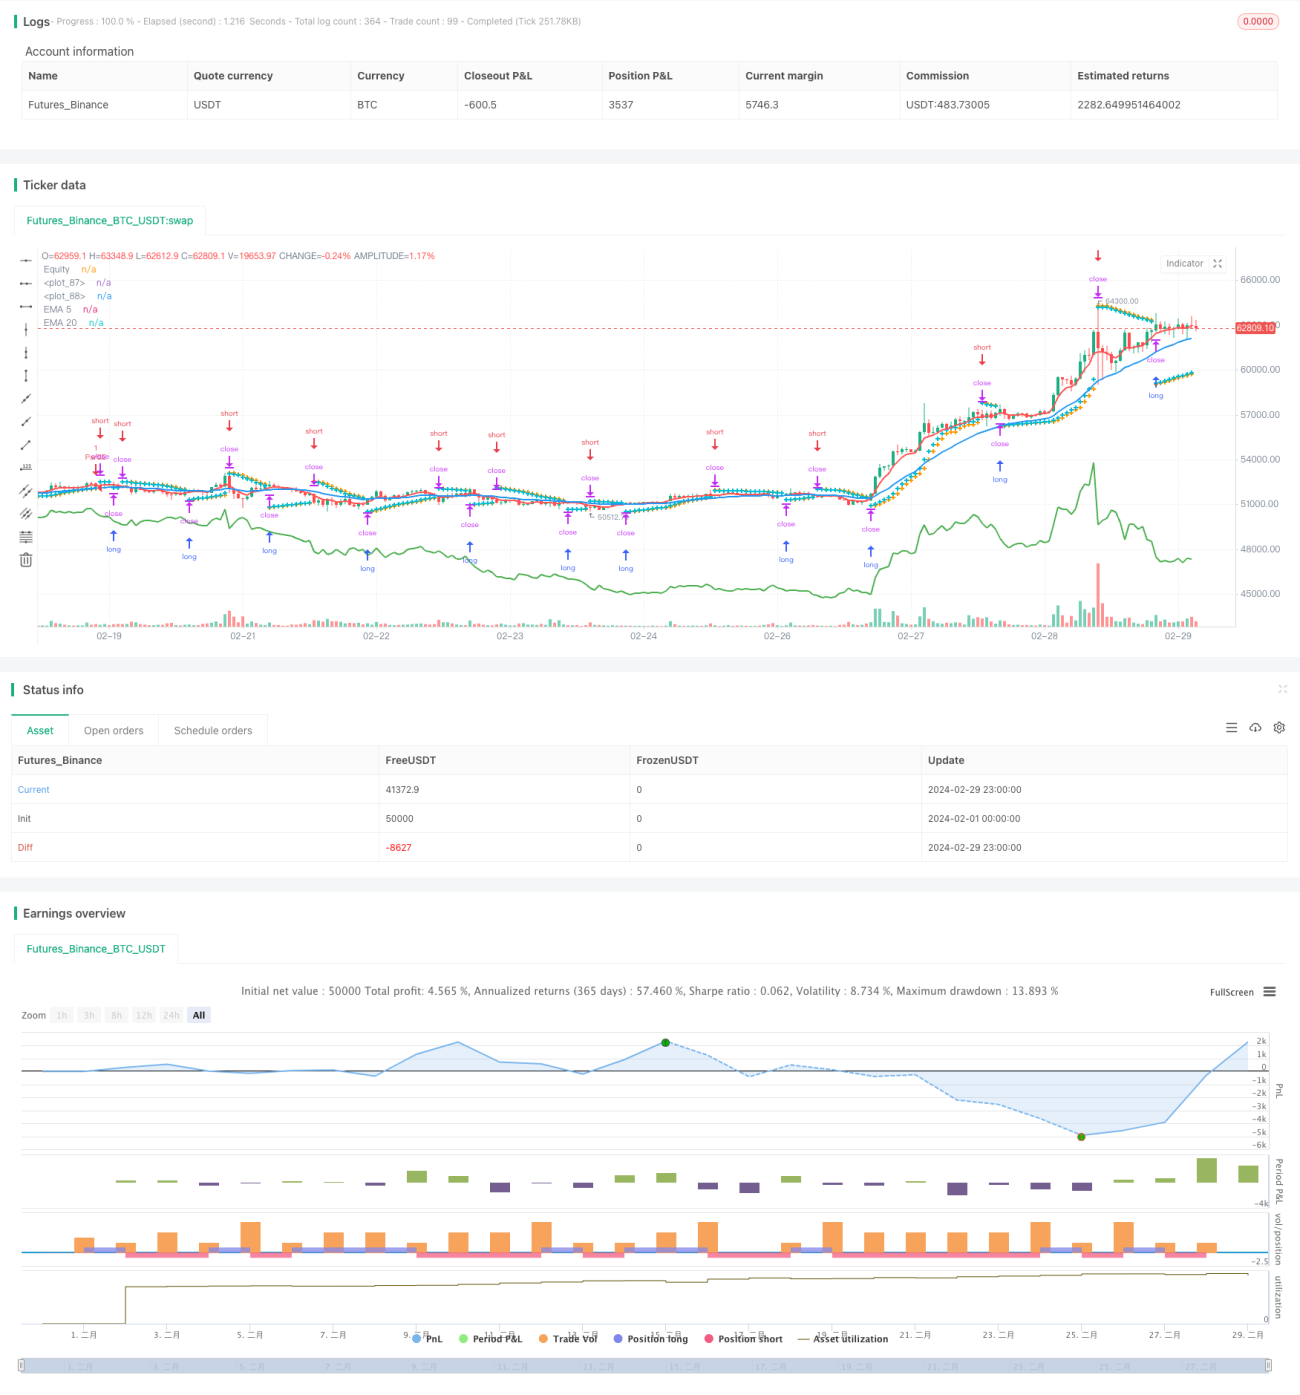
The EPTS strategy is a trend-following strategy based on the Parabolic SAR indicator and two exponential moving averages (EMAs) with different periods. The strategy uses the Parabolic SAR indicator to determine the current market trend direction and generates entry signals by considering the relative positions of the fast and slow EMAs. The main idea behind the strategy is "trend following," which means going long in an uptrend and short in a downtrend to achieve stable returns.
Strategy Principles
-
The Parabolic SAR indicator is used to determine the direction of the current market trend. When the parabolic is above the candlesticks, the market is in a downtrend; when the parabolic is below the candlesticks, the market is in an uptrend.
-
Two exponential moving averages (EMAs) with different periods are used to confirm the trend and generate entry signals. This strategy uses a 5-day EMA and a 20-day EMA. When the 5-day EMA is above the 20-day EMA, the market is considered to be in an uptrend; otherwise, it is considered to be in a downtrend.
-
Entry conditions: When both the Parabolic SAR and EMAs indicate an uptrend, a long signal is generated; when both the Parabolic SAR and EMAs indicate a downtrend, a short signal is generated.
-
Exit conditions: When the Parabolic SAR crosses the candlesticks, the current position is closed, and the strategy waits for the next entry signal.
-
Stop-loss: When entering a position, the stop-loss price is set at the current position of the Parabolic SAR. As the Parabolic SAR moves, the stop-loss position is dynamically adjusted, implementing a trailing stop-loss.
By combining the Parabolic SAR indicator and EMAs, the EPTS strategy can effectively capture market trends and close positions in a timely manner when the trend reverses, controlling risk. Additionally, the dynamic stop-loss setting further reduces the strategy's drawdown risk.
Advantages
-
Trend following: The EPTS strategy is based on the idea of trend following, which can effectively capture the main trends in the market and achieve stable returns.
-
Dynamic stop-loss: The strategy uses the Parabolic SAR as a dynamic stop-loss, adjusting the stop-loss position as the trend develops, effectively controlling risk.
-
Dual confirmation: By using dual confirmation from the Parabolic SAR and EMAs, the reliability of entry signals is improved, reducing false signals.
-
Simple and easy to use: The strategy logic is clear, and parameter settings are simple, making it easy to understand and implement.
Risk Analysis
-
Choppy markets: In choppy markets where trends are not obvious, the strategy may generate more false signals, leading to frequent trades and larger drawdowns.
-
Trend reversals: When market trends suddenly reverse, the strategy may delay closing positions, incurring some losses.
-
Parameter settings: The performance of the strategy is influenced by parameter settings, and different parameters may lead to different results.
Optimization Directions
-
Introduce more indicators: In addition to the existing Parabolic SAR and EMAs, introduce other trend-related indicators such as MACD and ADX to improve the accuracy of trend identification.
-
Optimize entry conditions: Optimize the entry conditions by considering factors such as the distance between the price and EMAs, trading volume, etc., to improve the quality of entry signals.
-
Dynamic parameter optimization: Dynamically adjust strategy parameters based on changes in market conditions, such as the step size of the Parabolic SAR and the periods of the EMAs, to adapt to different market environments.
-
Incorporate position sizing: Dynamically adjust position sizes based on the strength of market trends and account risk to control risk while improving returns.
Summary
The EPTS strategy is a trend-following strategy based on the Parabolic SAR indicator and moving averages. By capturing the main market trends and closing positions in a timely manner to control risk, it aims to achieve stable returns. The strategy logic is clear and easy to implement, suitable for market environments with clear trends. However, in choppy markets, the strategy may face significant drawdown risks and needs to be combined with other indicators and optimization methods to improve its adaptability and robustness. In addition, reasonable parameter settings and position sizing are also key to the successful operation of the strategy. Overall, the EPTS strategy provides a simple and effective approach to trend following, but still requires optimization and improvement based on actual market conditions to achieve better strategy performance.
- 1