策略概述
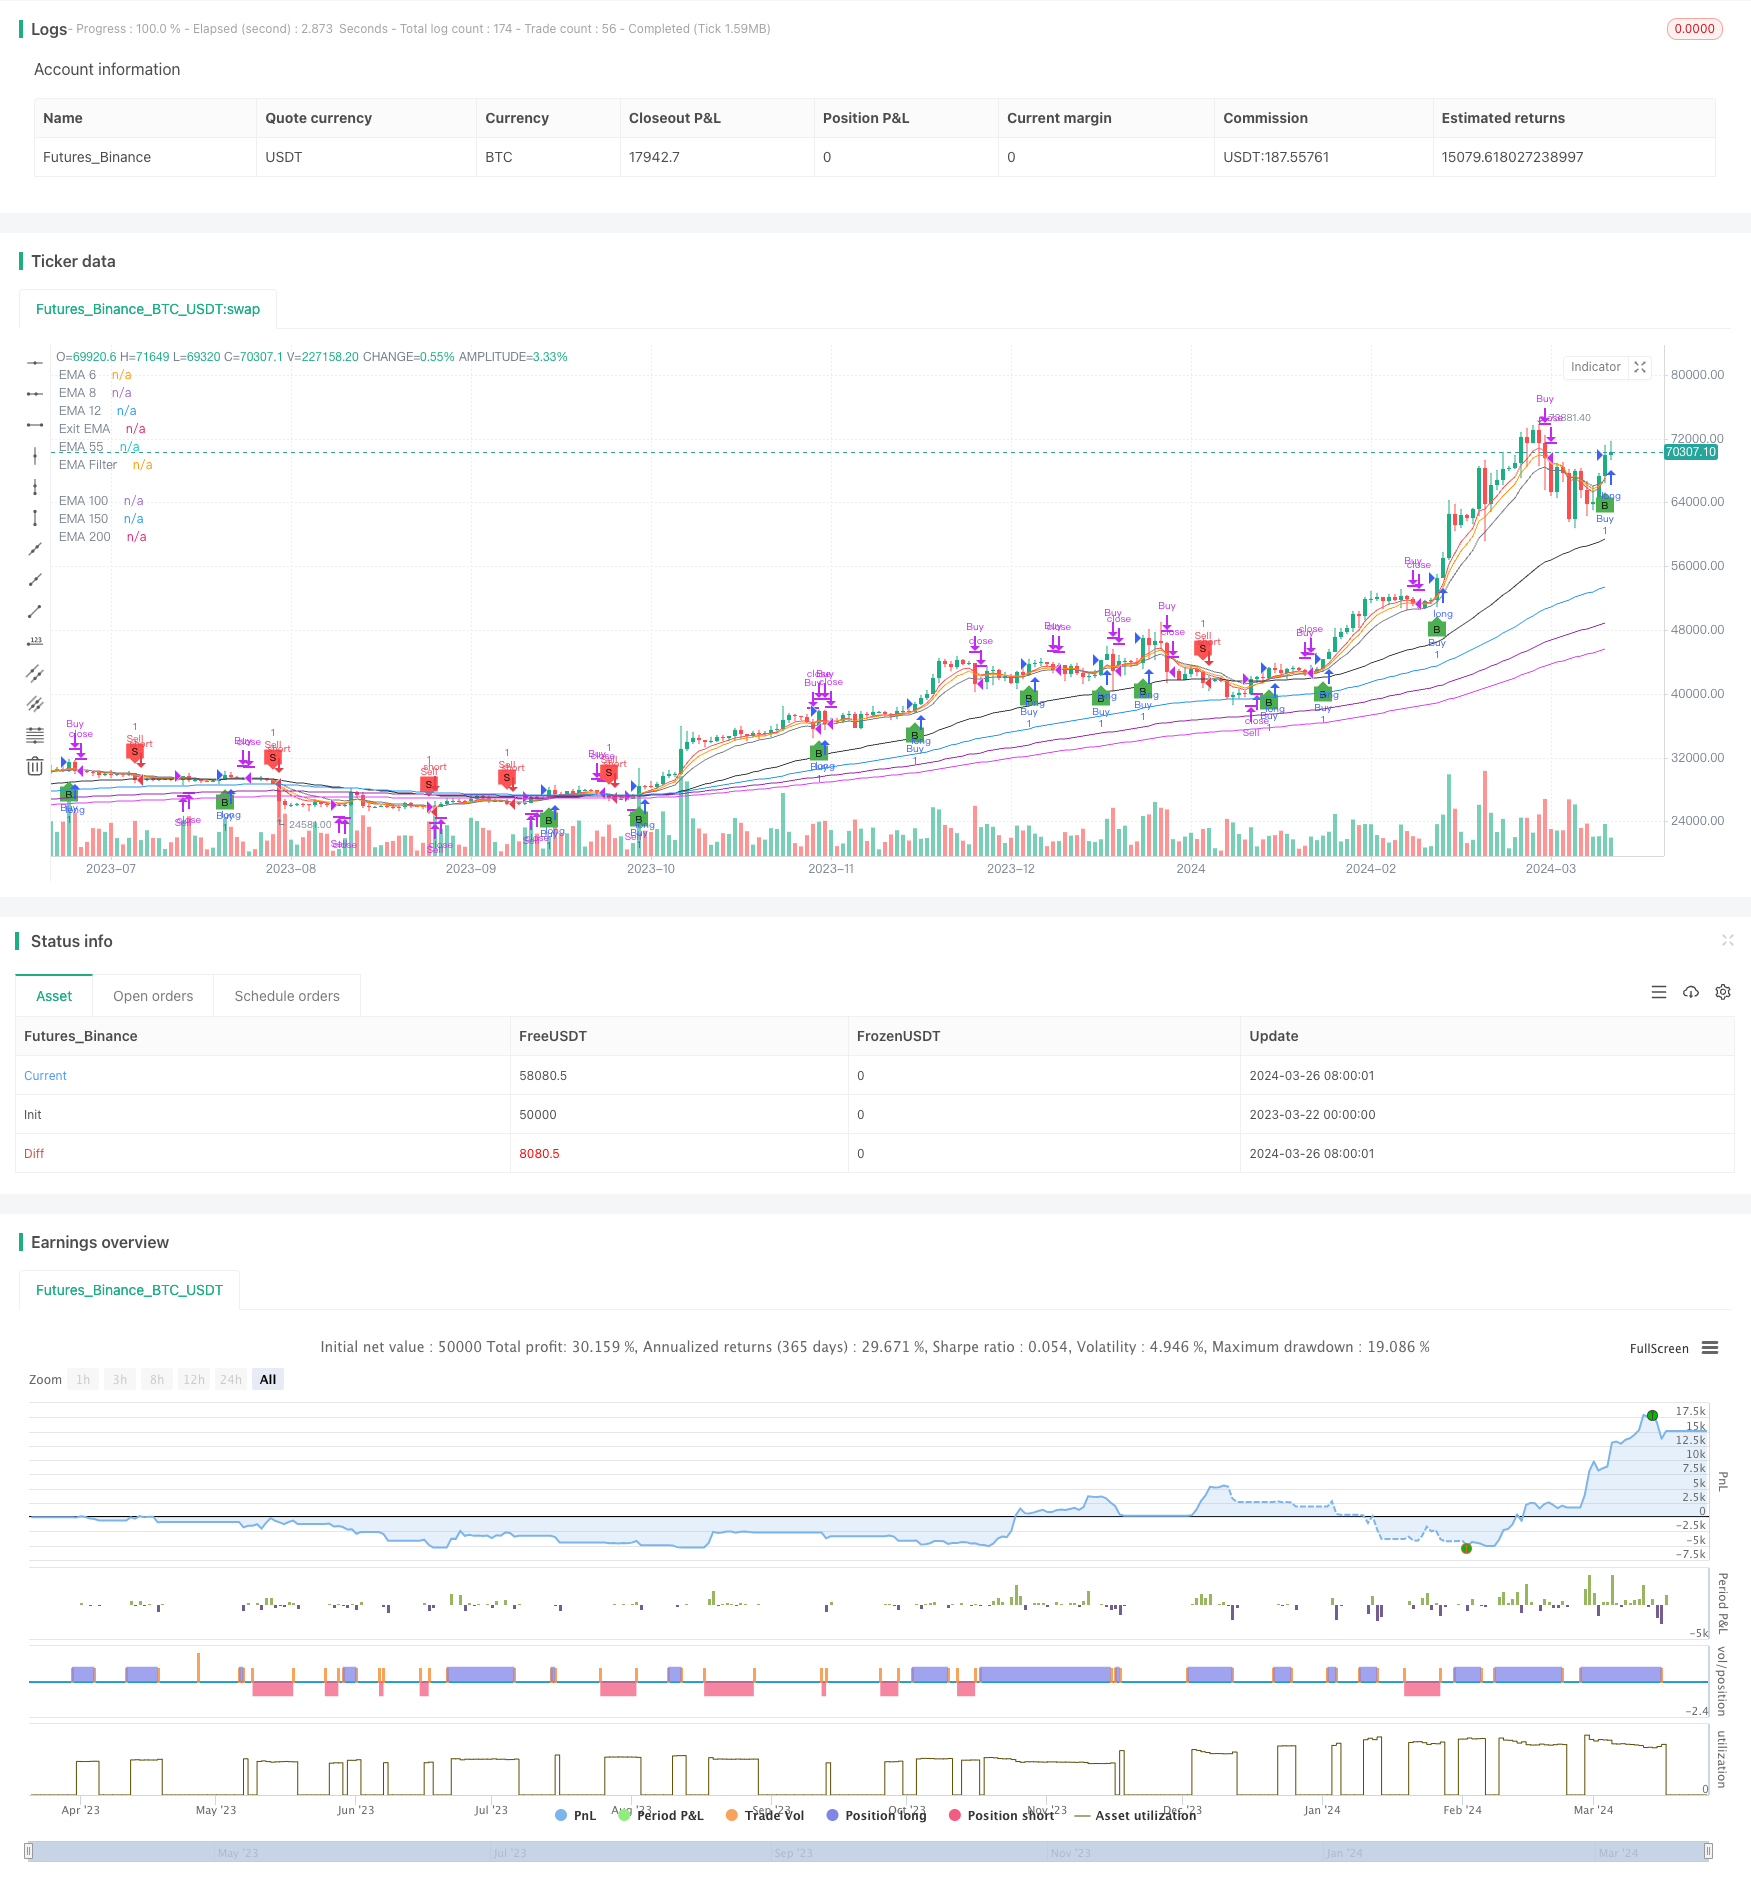
该策略结合了多个指数移动平均线(EMA)、相对强弱指数(RSI)以及基于标准差的出场条件来识别潜在的买卖机会。使用了短期(6、8、12天)、中期(55天)和长期(150、200、250天)的 EMA 来分析市场趋势的方向和强度。RSI 采用可配置的买入(30)和卖出(70)阈值来评估动量并识别超买或超卖状况。该策略还采用了一个独特的出场机制,当收盘价触及 12 日 EMA 的可配置标准差范围(默认为0.5)时触发出场,从而提供了一种潜在的保护利润或降低损失的方法。
策略原理
- 计算多个周期的 EMA(6、8、12、55、100、150、200)作为视觉参考,以评估市场趋势。
- 根据用户输入的蜡烛线数量(3-4根),计算最近 N 根蜡烛线的最高价和最低价。
- 买入条件:当前收盘价高于最近 N 根蜡烛线的最高价,且高于 EMA 过滤器(如果启用)。
- 卖出条件:当前收盘价低于最近 N 根蜡烛线的最低价,且低于 EMA 过滤器(如果启用)。
- 长仓出场条件:当前收盘价低于 12 日 EMA + 0.5 倍标准差,或低于 12 日 EMA。
- 短仓出场条件:当前收盘价高于 12 日 EMA - 0.5 倍标准差,或高于 12 日 EMA。
- 使用 RSI 作为辅助指标,默认周期为14,超卖阈值为30,超买阈值为70。
策略优势
- 结合了趋势跟踪(多重 EMA)和动量(RSI)两个维度,提供了更全面的市场分析视角。
- 独特的基于标准差的出场机制,可在保护利润和控制风险之间取得平衡。
- 代码模块化程度高,关键参数可由用户配置,灵活性强。
- 适用于多个品种和时间周期,特别是日线的股票和比特币交易。
风险分析
- 在震荡市或趋势反转初期,频繁出现虚假信号,导致连续亏损。
- 默认参数并非对所有市场环境都有效,需结合回测对参数进行优化。
- 单纯依赖本策略进行交易风险较大,建议结合其他指标、支撑阻力位等辅助决策。
- 对突发重大事件引发的趋势反转响应较慢。
优化方向
- 对 EMA 和 RSI 参数进行优化:根据品种、周期和市场特点,对各项参数组合进行穷举,寻找最佳参数区间。
- 加入止损止盈机制:参考 ATR 等波动率指标,设置合理的止损和止盈位,控制单笔交易风险。
- 引入仓位管理:可根据趋势强度(如 ADX)或距离关键支撑阻力位远近,调节仓位大小。
- 与其他技术指标组合使用:如布林带、MACD、均线交叉等,提高开平仓信号可靠性。
- 分市场状态优化:对趋势、震荡、转折等不同市场状态分别优化参数组合。
总结
本文提出了一个基于多重移动平均线、RSI 和标准差出场的蜡烛线高度突破交易策略。该策略从趋势和动量两个维度对市场进行分析,同时采用了独特的标准差出场机制,在捕捉趋势机会的同时兼顾风险控制。策略思路清晰,逻辑严谨,代码实现简洁高效。经过合理优化,该策略有望成为一个稳健的日内中高频交易策略。但需注意,任何策略都有其局限性,盲目使用可能带来风险。量化交易不应是机械的”信号-下单”过程,而应建立在对整体市场态势的把握和审慎的风险管理之上。交易者还需不断评估策略表现,适时调整,并与自己的交易风格和承受能力相结合,才能长期立于不败之地。
策略源码
/*backtest
start: 2023-03-22 00:00:00
end: 2024-03-27 00:00:00
period: 1d
basePeriod: 1h
exchanges: [{"eid":"Futures_Binance","currency":"BTC_USDT"}]
*/

//@version=5
strategy("Candle Height Breakout with Configurable Exit and Signal Control", shorttitle="CHB Single Signal", overlay=true)

// Input parameters for EMA filter and its length
useEmaFilter = input.bool(true, "Use EMA Filter", group="Entry Conditions")
emaFilterLength = input.int(55, "EMA Filter Length", minval=1, group="Entry Conditions")
candleCount = input.int(4, "SamG Configurable Candle Count for Entry", minval=3, maxval=4, step=1, group="Entry Conditions")
exitEmaLength = input.int(12, "Exit EMA Length", minval=1, group="Exit Conditions", defval=12)
exitStdDevMultiplier = input.float(0.5, "Exit Std Dev Multiplier", minval=0.1, maxval=2.0, step=0.1, group="Exit Conditions")

// State variables to track if we are in a long or short position
var bool inLong = false
var bool inShort = false

// Calculating EMAs with fixed periods for visual reference
ema6 = ta.ema(close, 6)
ema8 = ta.ema(close, 8)
ema12 = ta.ema(close, 12)
ema55 = ta.ema(close, 55)
ema100 = ta.ema(close, 100)
ema150 = ta.ema(close, 150)
ema200 = ta.ema(close, 200)
emaFilter = ta.ema(close, emaFilterLength)
exitEma = ta.ema(close, exitEmaLength)

// Plotting EMAs
plot(ema6, "EMA 6", color=color.red)
plot(ema8, "EMA 8", color=color.orange)
plot(ema12, "EMA 12", color=color.yellow)
plot(ema55, "EMA 55", color=color.green)
plot(ema100, "EMA 100", color=color.blue)
plot(ema150, "EMA 150", color=color.purple)
plot(ema200, "EMA 200", color=color.fuchsia)
plot(emaFilter, "EMA Filter", color=color.black)
plot(exitEma, "Exit EMA", color=color.gray)

// Calculating the highest and lowest of the last N candles based on user input
highestOfN = ta.highest(high[1], candleCount)
lowestOfN = ta.lowest(low[1], candleCount)

// Entry Conditions with EMA Filter
longEntryCondition = not inLong and not inShort and (close > highestOfN) and (not useEmaFilter or (useEmaFilter and close > emaFilter))
shortEntryCondition = not inLong and not inShort and (close < lowestOfN) and (not useEmaFilter or (useEmaFilter and close < emaFilter))

// Update position state on entry
if (longEntryCondition)
    strategy.entry("Buy", strategy.long, comment="B")
    inLong := true
    inShort := false

if (shortEntryCondition)
    strategy.entry("Sell", strategy.short, comment="S")
    inLong := false
    inShort := true

// Exit Conditions based on configurable EMA and Std Dev Multiplier
smaForExit = ta.sma(close, exitEmaLength)
upperExitBand = smaForExit + exitStdDevMultiplier * ta.stdev(close, exitEmaLength)
lowerExitBand = smaForExit - exitStdDevMultiplier * ta.stdev(close, exitEmaLength)

exitConditionLong = inLong and (close < upperExitBand or close < exitEma)
exitConditionShort = inShort and (close > lowerExitBand or close > exitEma)

// Strategy exits
if (exitConditionLong)
    strategy.close("Buy", comment="Exit")
    inLong := false

if (exitConditionShort)
    strategy.close("Sell", comment="Exit")
    inShort := false

// Visualizing entry and exit points
plotshape(series=longEntryCondition, style=shape.labelup, location=location.belowbar, color=color.green, size=size.tiny, title="Buy Signal", text="B")
plotshape(series=shortEntryCondition, style=shape.labeldown, location=location.abovebar, color=color.red, size=size.tiny, title="Sell Signal", text="S")