概述
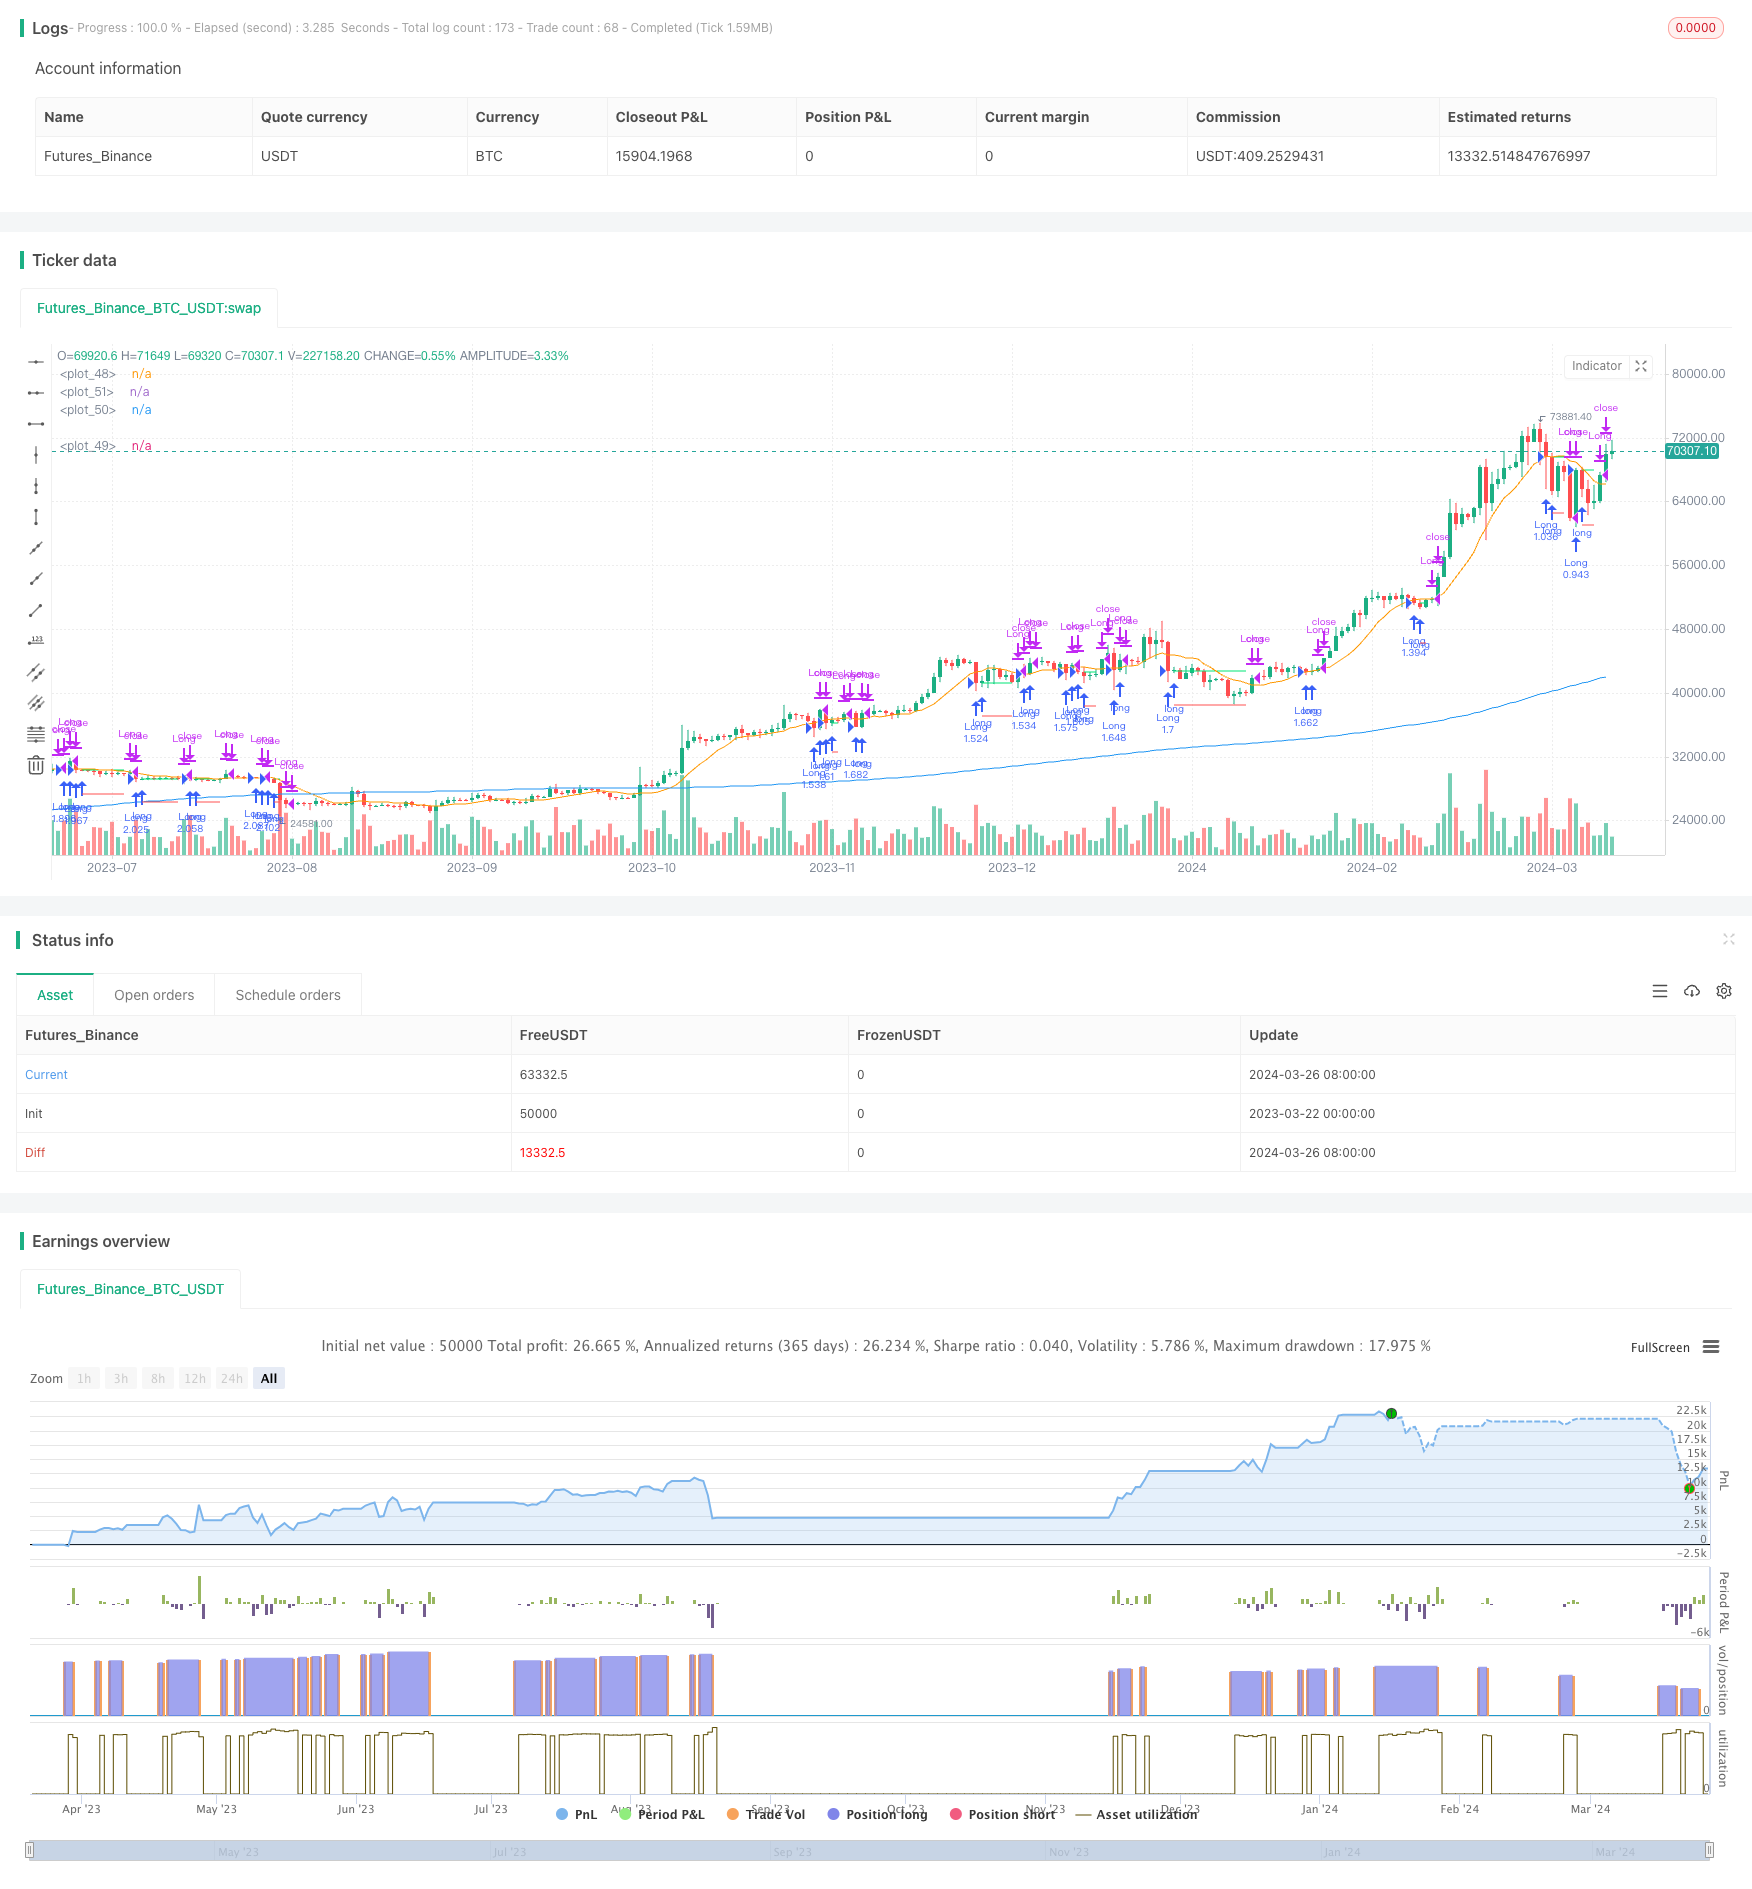
该策略主要思路是利用两条不同周期的移动平均线来捕捉市场回调后的反弹机会。当价格在长期均线之上且出现向短期均线回调时,策略开仓做多,并在价格重新站上短期均线或触及止损价位时平仓。该策略通过在趋势中寻找回调买入机会,力求在趋势行情中获取利润。
策略原理
- 计算两条不同周期的移动平均线(MA1和MA2),其中MA1为长期均线,MA2为短期均线。
- 当收盘价在MA1之上且低于MA2时,同时当前无持仓,且当前时间在设定的交易时间范围内,策略开仓做多。
- 记录开仓价格buyPrice,并计算止损价stopPrice(即开仓价下跌i_stopPercent百分比)。
- 当收盘价重新站上MA2并且i_lowerClose为false,或者收盘价跌破止损价stopPrice时,策略平仓。
- 若i_lowerClose为true,则在收盘价高于MA2且前一根K线收盘价低于MA2时平仓。
策略优势
- 趋势跟踪:通过判断价格与长期均线的位置关系,确定当前的总体趋势,在趋势中寻找入场机会。
- 回调买入:在上升趋势中寻找价格回调至短期均线的买入机会,提高了买入点位的性价比。
- 止损保护:设置止损价位,当价格逆向波动达到一定幅度时自动平仓,有效控制下行风险。
- 灵活参数:用户可以根据自己的偏好,灵活设置均线周期、止损百分比、是否在前一根K线收盘价低于短期均线时平仓等参数。
策略风险
- 参数优化:不同的参数设置对策略表现有很大影响,需要在不同市场环境下进行参数优化和回测,以寻找最佳参数组合。
- 震荡市:在震荡市场中,价格在长短期均线间频繁波动,可能导致策略频繁开平仓,损耗较多交易成本。
- 趋势转折:当市场趋势发生转折时,策略可能出现连续亏损的情况。此时需要结合其他指标或者信号对趋势转折进行判断,及时调整策略。
- 黑天鹅事件:市场出现重大的、无法预测的突发事件时,可能导致价格剧烈波动,触发止损后策略面临较大亏损。
策略优化方向
- 趋势判断:在开仓前引入更多的趋势判断指标,如ADX等,以确认当前趋势的强度和方向,提高开仓信号的准确性。
- 动态止损:根据价格波动率、ATR等指标动态调整止损位,在价格波动较大时适当放宽止损,而在价格波动较小时收紧止损。
- 仓位管理:根据市场趋势强度、价格波动率等因素,动态调整每次开仓的仓位大小,在趋势强且波动率适中时加大仓位,在趋势弱或波动率过高时减小仓位。
- 多空对冲:考虑同时监测多空双方的信号,在不同市场或周期中对冲开仓,以降低策略的整体风险。
总结
移动平均回调追踪策略通过两条不同周期均线的相对位置关系,捕捉价格在上升趋势中的回调做多机会。该策略适用于趋势型市场,通过设置适当的参数和止损,可以在趋势行情中获取稳定收益。但在震荡市和趋势转折时,该策略面临一定风险。通过引入更多指标、优化仓位管理和动态止损等方法,可以进一步提升该策略的表现和稳定性。
策略源码
/*backtest
start: 2023-03-22 00:00:00
end: 2024-03-27 00:00:00
period: 1d
basePeriod: 1h
exchanges: [{"eid":"Futures_Binance","currency":"BTC_USDT"}]
*/

// This Pine Script™ code is subject to the terms of the Mozilla Public License 2.0 at https://mozilla.org/MPL/2.0/
// © contapessoal_ivan
// @version=5
strategy("Pullback Strategy",
     overlay=true,
     initial_capital=1000,
     default_qty_type=strategy.percent_of_equity,
     default_qty_value=100, // 100% of balance invested on each trade
     commission_type=strategy.commission.cash_per_contract,
     commission_value=0.005) // Interactive Brokers rate

// Get user input
i_ma1           = input.int(title="MA 1 Length", defval=200, step=10, group="Strategy Parameters", tooltip="Long-term MA")
i_ma2           = input.int(title="MA 2 Length", defval=10, step=10, group="Strategy Parameters", tooltip="Short-term MA")
i_stopPercent   = input.float(title="Stop Loss Percent", defval=0.10, step=0.1, group="Strategy Parameters", tooltip="Failsafe Stop Loss Percent Decline")
i_lowerClose    = input.bool(title="Exit On Lower Close", defval=false, group="Strategy Parameters", tooltip="Wait for a lower-close before exiting above MA2")
i_startTime     = input(title="Start Filter", defval=timestamp("26 Jan 2023 00:00 +0000"), group="Time Filter", tooltip="Start date & time to begin searching for setups")
i_endTime       = input(title="End Filter", defval=timestamp("26 Mar 2024 23:59 +0000"), group="Time Filter", tooltip="End date & time to stop searching for setups")

// Get indicator values
ma1 = ta.sma(close, i_ma1)
ma2 = ta.sma(close, i_ma2)

// Check filter(s)
f_dateFilter = true

// Check buy/sell conditions
var float buyPrice = 0
buyCondition    = close > ma1 and close < ma2 and strategy.position_size == 0 and f_dateFilter
sellCondition   = close > ma2 and strategy.position_size > 0 and (not i_lowerClose or close < low[1])
stopDistance    = strategy.position_size > 0 ? ((buyPrice - close) / close) : na
stopPrice       = strategy.position_size > 0 ? buyPrice - (buyPrice * i_stopPercent) : na
stopCondition   = strategy.position_size > 0 and stopDistance > i_stopPercent

// Enter positions
if buyCondition
    strategy.entry(id="Long", direction=strategy.long)

if buyCondition[1]
    buyPrice := open

// Exit positions
if sellCondition or stopCondition
    strategy.close(id="Long", comment="Exit" + (stopCondition ? "SL=true" : ""))
    buyPrice := na

// Draw pretty colors
plot(buyPrice, color=color.lime, style=plot.style_linebr)
plot(stopPrice, color=color.red, style=plot.style_linebr, offset=-1)
plot(ma1, color=color.blue)
plot(ma2, color=color.orange)