概述
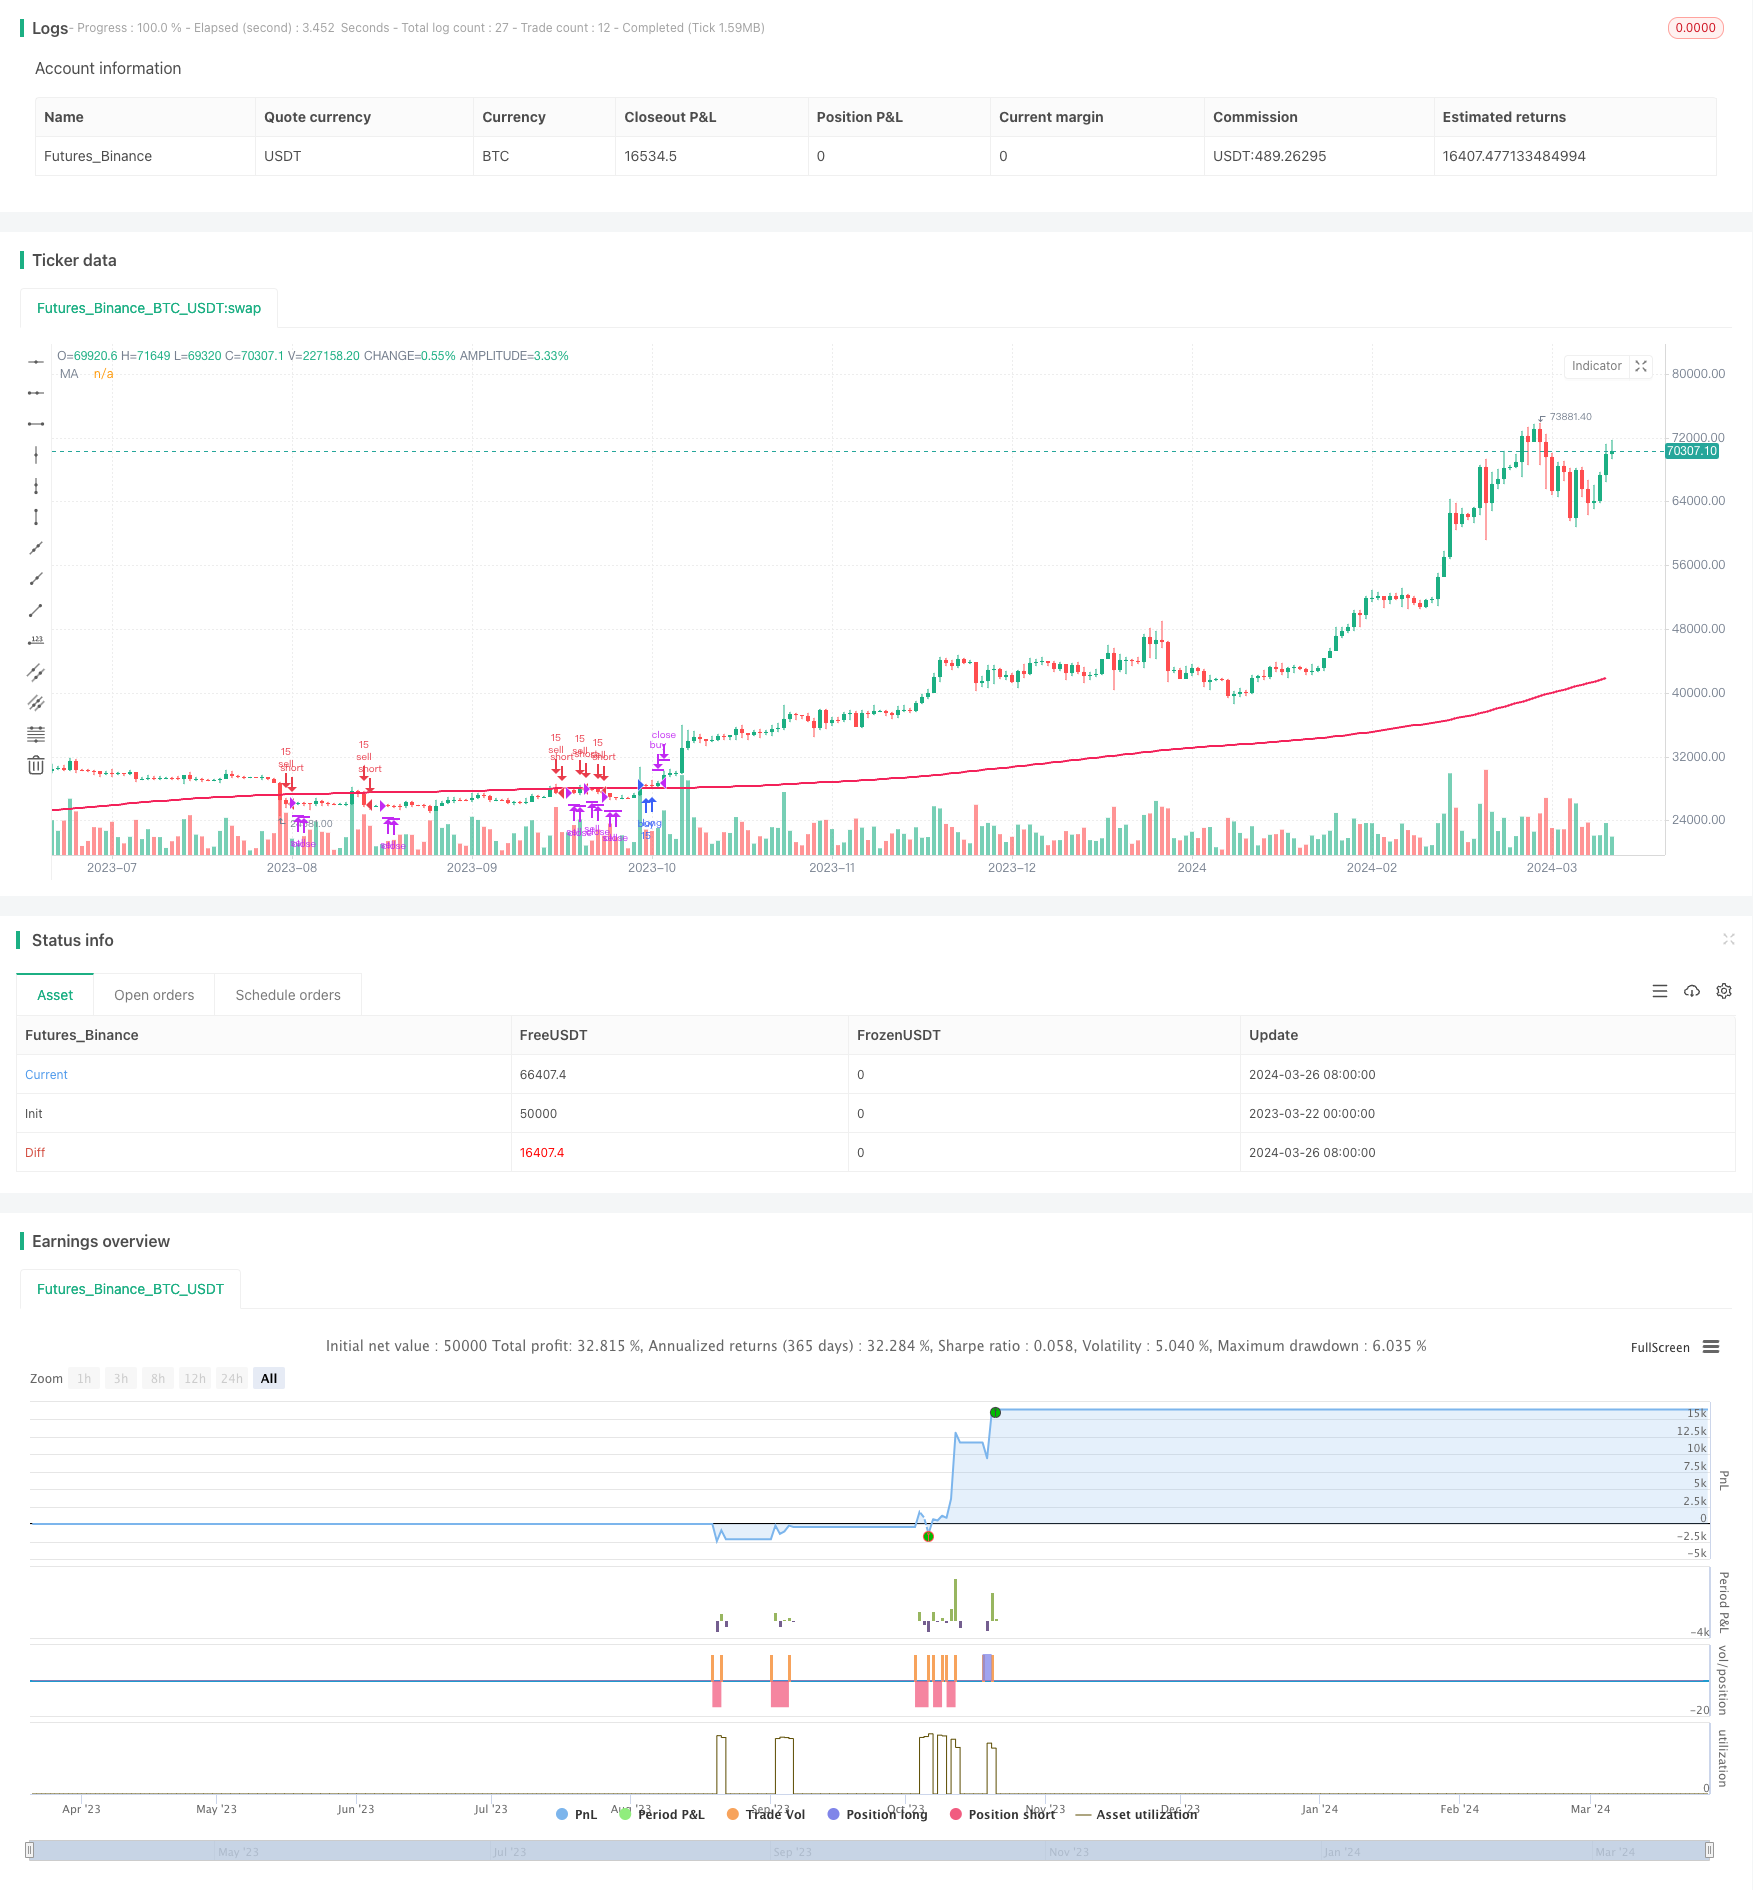
该策略是一个基于简单移动平均线(SMA)的BankNifty期货交易策略。策略的主要思路是利用SMA作为趋势指标,当价格上穿SMA时做多,当价格下穿SMA时做空。同时,该策略还设置了止损和止盈条件,以控制风险和锁定利润。
策略原理
该策略的核心是使用SMA作为趋势指标。具体来说,策略首先计算指定周期(默认为200)的SMA,然后根据价格与SMA的相对位置来判断趋势方向。当价格上穿SMA时,认为上升趋势已经形成,此时做多;当价格下穿SMA时,认为下降趋势已经形成,此时做空。此外,该策略还设置了止损和止盈条件,以控制风险和锁定利润。止损条件包括:价格突破SMA一定范围(由”Stop Loss Buffer”参数设置)、价格突破开仓价一定范围(由”Stop Loss”参数设置)以及交易时间到达15:00。止盈条件为价格突破开仓价一定范围(由”Target Price”参数设置)。
策略优势
- 简单易懂:该策略基于SMA这一经典技术指标,原理简单,易于理解和实现。
- 适应性强:该策略可以通过调整参数来适应不同的市场环境和交易品种。
- 风险控制:该策略设置了多重止损条件,可以有效控制潜在损失。同时,止盈条件的设置也有助于及时锁定利润。
- 趋势跟踪:SMA是一个滞后性指标,但也正因为如此,它可以很好地确认趋势的形成。该策略利用SMA的这一特点,能够有效捕捉市场的中长期趋势。
策略风险
- 参数敏感:该策略的表现很大程度上取决于参数的选择,不同的参数设置可能会导致截然不同的结果。因此,在实际应用中需要对参数进行优化和测试。
- 震荡市场:在震荡市场中,价格频繁地上下穿越SMA,可能会导致该策略频繁交易,从而增加交易成本和风险。
- 趋势逆转:当市场趋势发生逆转时,该策略可能会延迟反应,导致潜在损失。
- 盘中波动:该策略在盘中任何时候都可能触发交易信号,而BankNifty期货的盘中波动可能较大,这可能导致较大的滑点和潜在损失。
策略优化方向
- 参数优化:可以通过对不同参数组合进行回测和优化,找到最适合当前市场环境的参数设置。
- 结合其他指标:可以考虑将SMA与其他技术指标(如RSI、MACD等)相结合,以提高策略的可靠性和准确性。
- 动态止损:可以考虑采用动态止损策略(如跟踪止损),以更好地控制风险。
- 限制交易时间:可以考虑将交易时间限制在波动较小的时间段(如开盘和收盘前后),以减少盘中波动的影响。
总结
该策略是一个基于SMA的简单交易策略,适用于BankNifty期货。它的优点在于原理简单,适应性强,同时设有风控措施。但在实际应用中,还需要注意参数优化、震荡市场、趋势逆转和盘中波动等潜在风险。未来可以考虑从参数优化、结合其他指标、动态止损和限制交易时间等方面对策略进行优化和改进。
策略源码
// This Pine Script™ code is subject to the terms of the Mozilla Public License 2.0 at https://mozilla.org/MPL/2.0/
// © Bhasker_S

//@version=5
strategy("Strategy BankNifty SMA", overlay=true, margin_long=100, margin_short=100)

src = input(close, title="Source")
timeFrame = input.timeframe(defval='5', title = "Select Chart Timeframe")
typeMA = input.string(title = "Method", defval = "SMA", options=["SMA", "EMA", "SMMA (RMA)", "WMA", "VWMA"])
len = input.int(200, minval=1, title="Length", step = 10)
alertPrecision = input.float(0, "Alert Precision", minval = 0, maxval = 50, step=1)
slTimeFrame = input.timeframe(defval='1', title = "Select Stoploss Candle Timeframe")
slBuffer = input.float(0, "Stop Loss Buffer", minval = 0, maxval = 50, step = 1)
targetSlab = input.float(150, "Target Price", minval = 1, maxval = 2000, step = 10)
Stoploss  = input.float(20, "Stop Loss", minval = 1, maxval = 2000, step = 5)
offset = input.int(title="Offset", defval=0, minval=-500, maxval=500)

//out = ta.sma(src, len)


ma(source, length, type) =>
    switch type
        "SMA" => ta.sma(source, length)
        "EMA" => ta.ema(source, length)
        "SMMA (RMA)" => ta.rma(source, length)
        "WMA" => ta.wma(source, length)
        "VWMA" => ta.vwma(source, length)

tfSource = request.security(syminfo.tickerid, timeFrame, src, barmerge.gaps_on, barmerge.lookahead_off)
mySMA = ma(tfSource, len, typeMA)
plot(mySMA, color=color.rgb(243, 33, 89), title="MA", offset=offset, linewidth = 2)

slClose = request.security(syminfo.tickerid, slTimeFrame, src, barmerge.gaps_on, barmerge.lookahead_off)


highTravel = low > mySMA
lowTravel = high < mySMA

touchabove = (((high[1] + alertPrecision) > mySMA[1]) and (low[1] < mySMA[1])) //and (high[2] < mySMA[2])
touchbelow = (((low[1] - alertPrecision) < mySMA[1]) and (high[1] > mySMA[1])) //and (low[2] > mySMA[2])

crossabove = math.min(open, close) > mySMA
crossbelow = math.max(open, close) < mySMA

upalert = (touchabove or touchbelow) and crossabove
downalert = (touchabove or touchbelow) and crossbelow

h=hour(time('1'),"Asia/Kolkata")
m=minute(time('1'),"Asia/Kolkata")
startTime=h*100+m

if upalert and strategy.position_size == 0
    strategy.entry("buy", strategy.long, 15)

if downalert and strategy.position_size == 0
    strategy.entry("sell", strategy.short, 15)

longexit = (slClose < (mySMA - slBuffer)) or (slClose < (strategy.opentrades.entry_price(strategy.opentrades - 1) - Stoploss)) or (slClose > (strategy.opentrades.entry_price(strategy.opentrades - 1) + targetSlab)) or (hour(time) == 15)
shortexit = (slClose > (mySMA + slBuffer)) or (slClose > (strategy.opentrades.entry_price(strategy.opentrades - 1) + Stoploss)) or (slClose < (strategy.opentrades.entry_price(strategy.opentrades - 1) - targetSlab)) or (hour(time) == 15)

if longexit
    strategy.close("buy")

if shortexit
    strategy.close("sell")