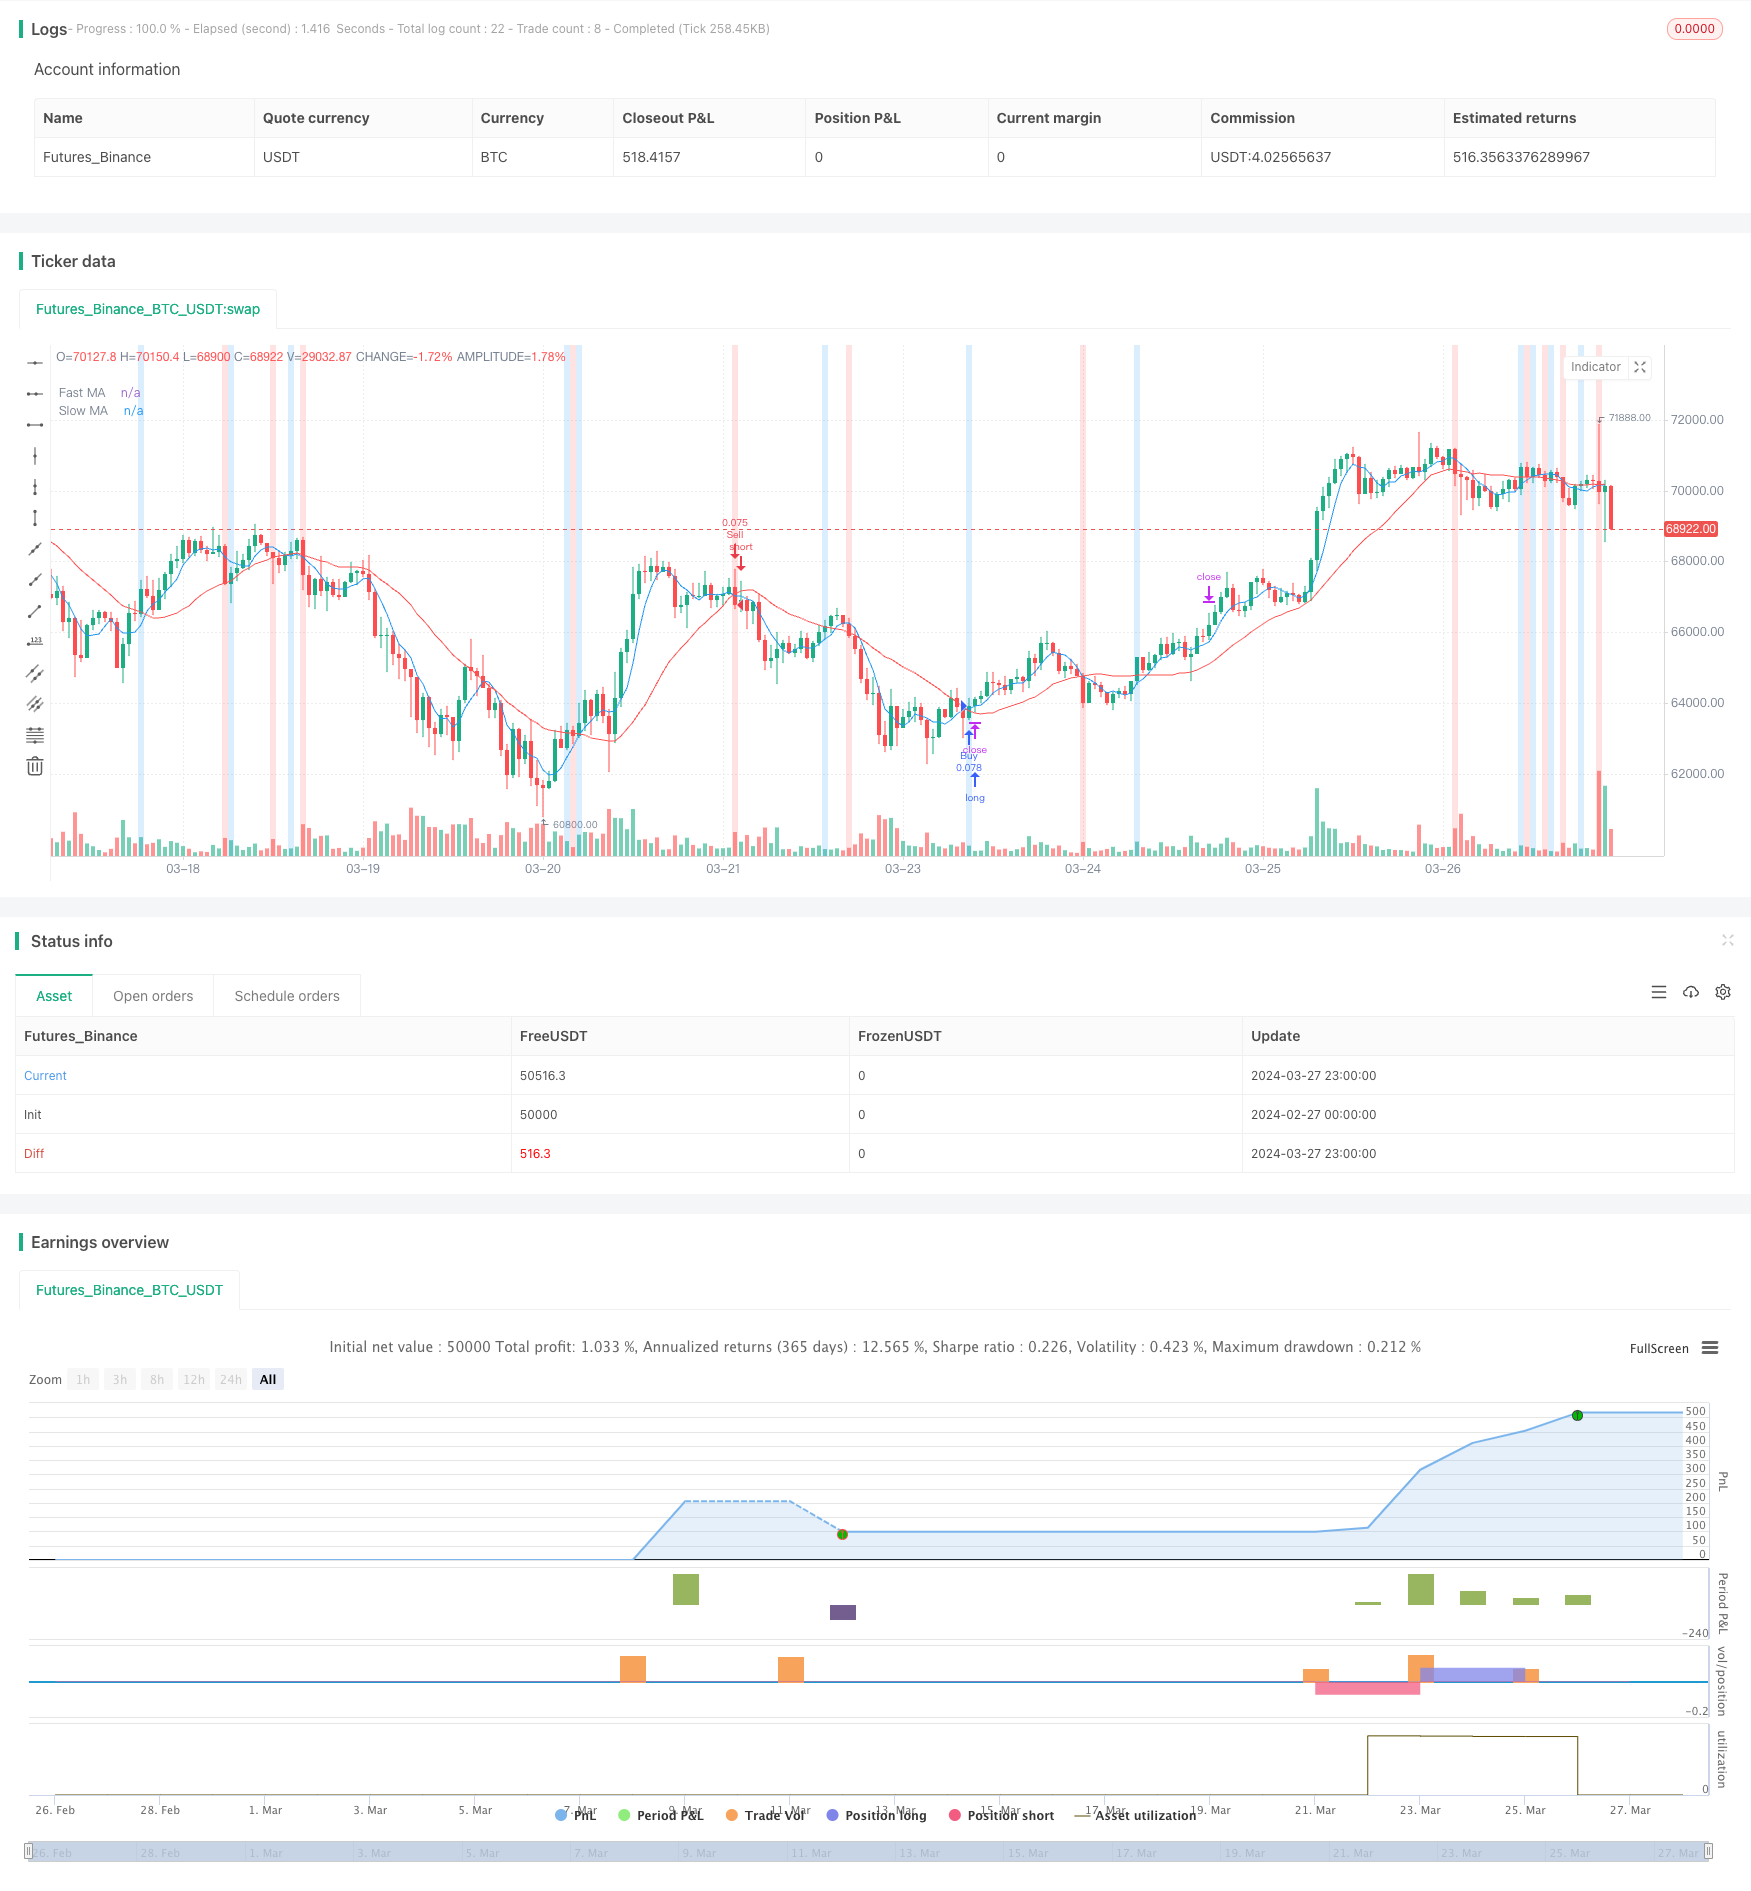
Dynamic Trend Following Strategy

Author: ChaoZhang, Date: 2024-03-29 11:38:18
Tags:

img

Overview

The “Dynamic Trend Following Strategy” is a quantitative trading strategy based on moving averages and trend ribbon indicators. The strategy utilizes crossover signals from fast and slow moving averages to identify potential buy and sell opportunities while using the trend ribbon indicator to confirm the strength of the trend. It also incorporates dynamic position sizing and stop loss/take profit mechanisms to optimize the risk-reward ratio.

With flexible parameter settings and API integration, the strategy can adapt to different trading styles and market conditions. The “Dynamic Trend Following Strategy” aims to help traders capture significant market swings and enter trades early in the formation of a trend to maximize profit potential.

Strategy Principles

The “Dynamic Trend Following Strategy” is based on the following core principles:

  1. Dual Moving Averages: The strategy uses fast and slow moving averages to determine the direction of the price trend. When the fast moving average crosses above the slow moving average, it indicates an uptrend and generates a buy signal. Conversely, when the fast moving average crosses below the slow moving average, it indicates a downtrend and generates a sell signal.

  2. Trend Ribbon Indicator: The strategy employs a trend ribbon indicator to measure the strength of the trend. When the price crosses above the trend ribbon, it signifies increasing bullish momentum. When the price crosses below the trend ribbon, it signifies increasing bearish momentum. The color change of the trend ribbon provides a visual cue for trend reversals.

  3. Dynamic Position Sizing: The strategy dynamically calculates the position size for each trade based on account leverage and portfolio percentage. This approach optimizes capital allocation while considering the trader’s risk tolerance.

  4. Stop Loss/Take Profit Mechanism: The strategy allows traders to set percentage-based stop loss and take profit levels. Once the predefined price levels are reached, this mechanism is triggered to protect profits and limit potential losses.

  5. API Integration: Through custom input fields for API parameters, the strategy offers flexible execution options. Traders can adjust parameters according to their preferences for automated trading.

Strategy Advantages

The “Dynamic Trend Following Strategy” offers several advantages:

  1. Trend Identification: By combining dual moving averages and the trend ribbon indicator, the strategy effectively identifies market trends, helping traders enter positions timely and capture trend opportunities.

  2. Dynamic Position Sizing: The strategy dynamically adjusts position sizes based on account leverage and portfolio percentage, optimizing capital allocation while managing risk exposure. This approach helps traders achieve consistent returns across different market conditions.

  3. Risk Management: The built-in stop loss/take profit mechanism provides risk management tools for each trade. Traders can set percentage levels according to their risk tolerance, thereby limiting potential losses to acceptable ranges.

  4. Flexibility: With API integration and customizable parameter inputs, the strategy can accommodate different trading styles and preferences. Traders can fine-tune the lengths of moving averages, trend ribbon parameters, and position sizing to optimize strategy performance and meet individual needs.

  5. Trend Capturing: The strategy aims to identify trends early and enter trades at the beginning stages of trend formation. By entering positions promptly, traders can maximize profit potential while reducing the risk of missing out on significant market moves.

Strategy Risks

While the “Dynamic Trend Following Strategy” offers various advantages, traders should also be aware of potential risks:

  1. Market Volatility: The strategy may generate frequent trading signals in volatile markets, leading to higher transaction costs and potential false signals. To mitigate this risk, traders can consider adjusting the lengths of moving averages or adding additional confirmation indicators.

  2. Trend Reversals: The strategy may suffer losses during sudden trend reversals. The stop loss mechanism can mitigate this risk to some extent, but in extreme market conditions, prices may rapidly break through stop loss levels, resulting in larger losses.

  3. Parameter Sensitivity: The performance of the strategy heavily depends on the choice of moving average and trend ribbon parameters. Improper parameter settings may lead to suboptimal results. Traders should optimize and adjust parameters based on different market conditions and asset classes.

  4. Overfitting: Overoptimizing parameters may result in the strategy being overfitted to historical data, leading to poor performance in live trading. To minimize this risk, traders should conduct thorough backtesting and forward testing of the strategy across various market conditions.

Strategy Optimization Directions

To further enhance the performance of the “Dynamic Trend Following Strategy,” the following optimization directions can be considered:

  1. Multiple Timeframe Analysis: Combining moving averages and trend ribbon indicators from different timeframes to gain a more comprehensive market perspective. This approach can help traders identify dominant trends while avoiding false signals from secondary fluctuations.

  2. Dynamic Parameter Adjustment: Dynamically adjusting the lengths of moving averages and trend ribbon parameters based on changing market conditions. This can be achieved by utilizing volatility indicators or machine learning algorithms to adapt to the evolving market environment.

  3. Enhanced Risk Management: Introducing more advanced risk management techniques, such as volatility-based position sizing or dynamic stop loss levels. These methods can help traders better control risk while maintaining strategy performance.

  4. Multi-Asset Diversification: Applying the strategy across multiple asset classes and markets to achieve portfolio diversification. This can reduce exposure to single market or asset risks and enhance the robustness of the strategy.

  5. Integration of Other Indicators: Considering the incorporation of other technical indicators or fundamental factors into the strategy to provide additional confirmation signals and filtering mechanisms. This can help traders avoid false signals and improve the overall accuracy of the strategy.

Conclusion

The “Dynamic Trend Following Strategy” is a quantitative trading approach based on moving averages and trend ribbon indicators, aiming to capture significant market trends and optimize the risk-reward ratio. With dynamic position sizing, stop loss/take profit mechanisms, and flexible parameter settings, the strategy can adapt to various trading styles and market conditions.

Although the strategy offers advantages such as trend identification, risk management, and flexibility, traders should also be aware of potential risks, including market volatility, trend reversals, and parameter sensitivity. To further optimize strategy performance, traders can consider multiple timeframe analysis, dynamic parameter adjustment, enhanced risk management, multi-asset diversification, and integration of other indicators.

Through prudent backtesting, continuous monitoring, and proper risk management, traders can leverage the “Dynamic Trend Following Strategy” to pursue consistent returns across different market environments. However, it is essential to remember that past performance does not guarantee future results, and traders should exercise caution and conduct thorough due diligence when implementing the strategy.


/*backtest
start: 2024-02-27 00:00:00
end: 2024-03-28 00:00:00
period: 1h
basePeriod: 15m
exchanges: [{"eid":"Futures_Binance","currency":"BTC_USDT"}]
*/

//@version=5
strategy("Big Runner", shorttitle="Sprinter", overlay=true,
         initial_capital=100000, 
         default_qty_type=strategy.percent_of_equity, 
         default_qty_value=100)

// Leverage Input
leverage = input.float(1, title="Leverage", minval=1, step=0.1)

// Moving Average Settings
fastLength = input(5, title="Fast Length")
slowLength = input(20, title="Slow Length")

fastMA = ta.sma(close, fastLength)
slowMA = ta.sma(close, slowLength)

// Trend Ribbon Settings
ribbonColor = input(true, title="Show Trend Ribbon")
ribbonLength = input(20, title="Ribbon Length")
ribbonColorUp = color.new(color.blue, 80)
ribbonColorDown = color.new(color.red, 80)

ribbonUp = ta.crossover(close, ta.sma(close, ribbonLength))
ribbonDown = ta.crossunder(close, ta.sma(close, ribbonLength))

// Buy and Sell Signals
buySignal = ta.crossover(close, fastMA) and ta.crossover(fastMA, slowMA)
sellSignal = ta.crossunder(close, fastMA) and ta.crossunder(fastMA, slowMA)

// Input for SL/TP percentages and toggle
use_sl_tp = input(true, title="Use Stop Loss/Take Profit")
take_profit_long_percent = input(4.0, title="Take Profit Long (%)") / 100
take_profit_short_percent = input(7.0, title="Take Profit Short (%)") / 100
stop_loss_long_percent = input(2.0, title="Stop Loss Long (%)") / 100
stop_loss_short_percent = input(2.0, title="Stop Loss Short (%)") / 100

// Calculate SL and TP levels
calculate_sl_tp(entryPrice, isLong) =>
    stopLoss = isLong ? entryPrice * (1 - stop_loss_long_percent) : entryPrice * (1 + stop_loss_short_percent)
    takeProfit = isLong ? entryPrice * (1 + take_profit_long_percent) : entryPrice * (1 - take_profit_short_percent)
    [stopLoss, takeProfit]

// Plotting Moving Averages
plot(fastMA, color=color.blue, title="Fast MA")
plot(slowMA, color=color.red, title="Slow MA")

// Plotting Trend Ribbon
bgcolor(ribbonColor ? ribbonUp ? ribbonColorUp : ribbonDown ? ribbonColorDown : na : na)

// Calculate position size based on the percentage of the portfolio and leverage
percentOfPortfolio = input.float(10, title="Percent of Portfolio")
positionSizePercent = percentOfPortfolio / 100 * leverage
positionSize = strategy.equity * positionSizePercent / close

// Strategy Execution with Leverage
var float stopLossLong = na
var float takeProfitLong = na
var float stopLossShort = na
var float takeProfitShort = na

if (buySignal)
    entryPrice = close
    [stopLossLong, takeProfitLong] = calculate_sl_tp(entryPrice, true)
    strategy.entry("Buy", strategy.long, qty=positionSize)
    if use_sl_tp
        strategy.exit("Take Profit Long", "Buy", limit=takeProfitLong)
        strategy.exit("Stop Loss Long", "Buy", stop=stopLossLong)

if (sellSignal)
    entryPrice = close
    [stopLossShort, takeProfitShort] = calculate_sl_tp(entryPrice, false)
    strategy.entry("Sell", strategy.short, qty=positionSize)
    if use_sl_tp
        strategy.exit("Take Profit Short", "Sell", limit=takeProfitShort)
        strategy.exit("Stop Loss Short", "Sell", stop=stopLossShort)

strategy.close("Buy", when = sellSignal)
strategy.close("Sell", when = buySignal)

// Manual Input Fields for API Parameters
var string api_enter_long = input("", title="API Enter Long Parameters")
var string api_exit_long = input("", title="API Exit Long Parameters")
var string api_enter_short = input("", title="API Enter Short Parameters")
var string api_exit_short = input("", title="API Exit Short Parameters")


More