概述
MACD趋势跟踪策略是一个基于MACD指标的量化交易策略。该策略的主要思路是利用MACD指标的金叉和死叉信号来判断趋势的方向,并在合适的时机建立多头或空头仓位。当MACD线上穿信号线并且上穿0轴时,开多头仓位;当MACD线下穿信号线并且下穿0轴时,开空头仓位。该策略使用最近的低点作为多头止损位,最近的高点作为空头止损位。平仓条件是MACD线反向穿越信号线。
策略原理
MACD趋势跟踪策略的核心原理是使用MACD指标来捕捉趋势的形成和反转。MACD指标由两条均线(快速均线和慢速均线)的差值构成,并配合信号线来生成交易信号。当MACD线上穿信号线并且上穿0轴时,表明上涨趋势形成,此时开多头仓位。当MACD线下穿信号线并且下穿0轴时,表明下跌趋势形成,此时开空头仓位。策略使用最近的显著低点作为多头止损位,最近的显著高点作为空头止损位,以控制风险。当MACD线反向穿越信号线时,平掉当前仓位。
策略优势
MACD趋势跟踪策略能够有效捕捉趋势性机会,在趋势形成初期就建仓,充分利用了趋势的动能。
该策略同时使用MACD金叉死叉和0轴作为过滤条件,能够较好地过滤掉震荡市中的虚假信号。
策略采用最近显著高低点作为止损位,能够控制单笔交易的风险敞口。
策略逻辑清晰,容易理解和实现,适合初学者学习。
策略风险
MACD指标本质上是一个滞后指标,在趋势反转初期可能会出现较大的回撤。
策略在震荡市中可能会出现频繁交易,导致较高的交易成本。
止损位的设置依赖于最近的显著高低点,在某些情况下可能出现止损过早或过晚的情况。
该策略没有考虑仓位管理和资金管理,实际应用中需要结合具体情况进行优化。
策略优化方向
可以考虑引入其他技术指标或价格行为模式作为过滤条件,以提高信号的可靠性和准确性。
优化止损位的设置方法,例如使用ATR或百分比止损等方式,以更好地控制风险。
引入仓位管理和资金管理机制,根据市场波动性和账户equity等来动态调整仓位大小。
针对不同的市场和交易标的,对参数进行优化和调整,找到最适合的参数组合。
总结
MACD趋势跟踪策略是一个简单而有效的量化交易策略,通过利用MACD指标的特性来捕捉趋势性机会。该策略逻辑清晰,易于理解和实现,适合初学者学习。但在实际应用中,需要注意控制风险,并结合其他方法进行优化和改进,以获得更稳健的交易表现。
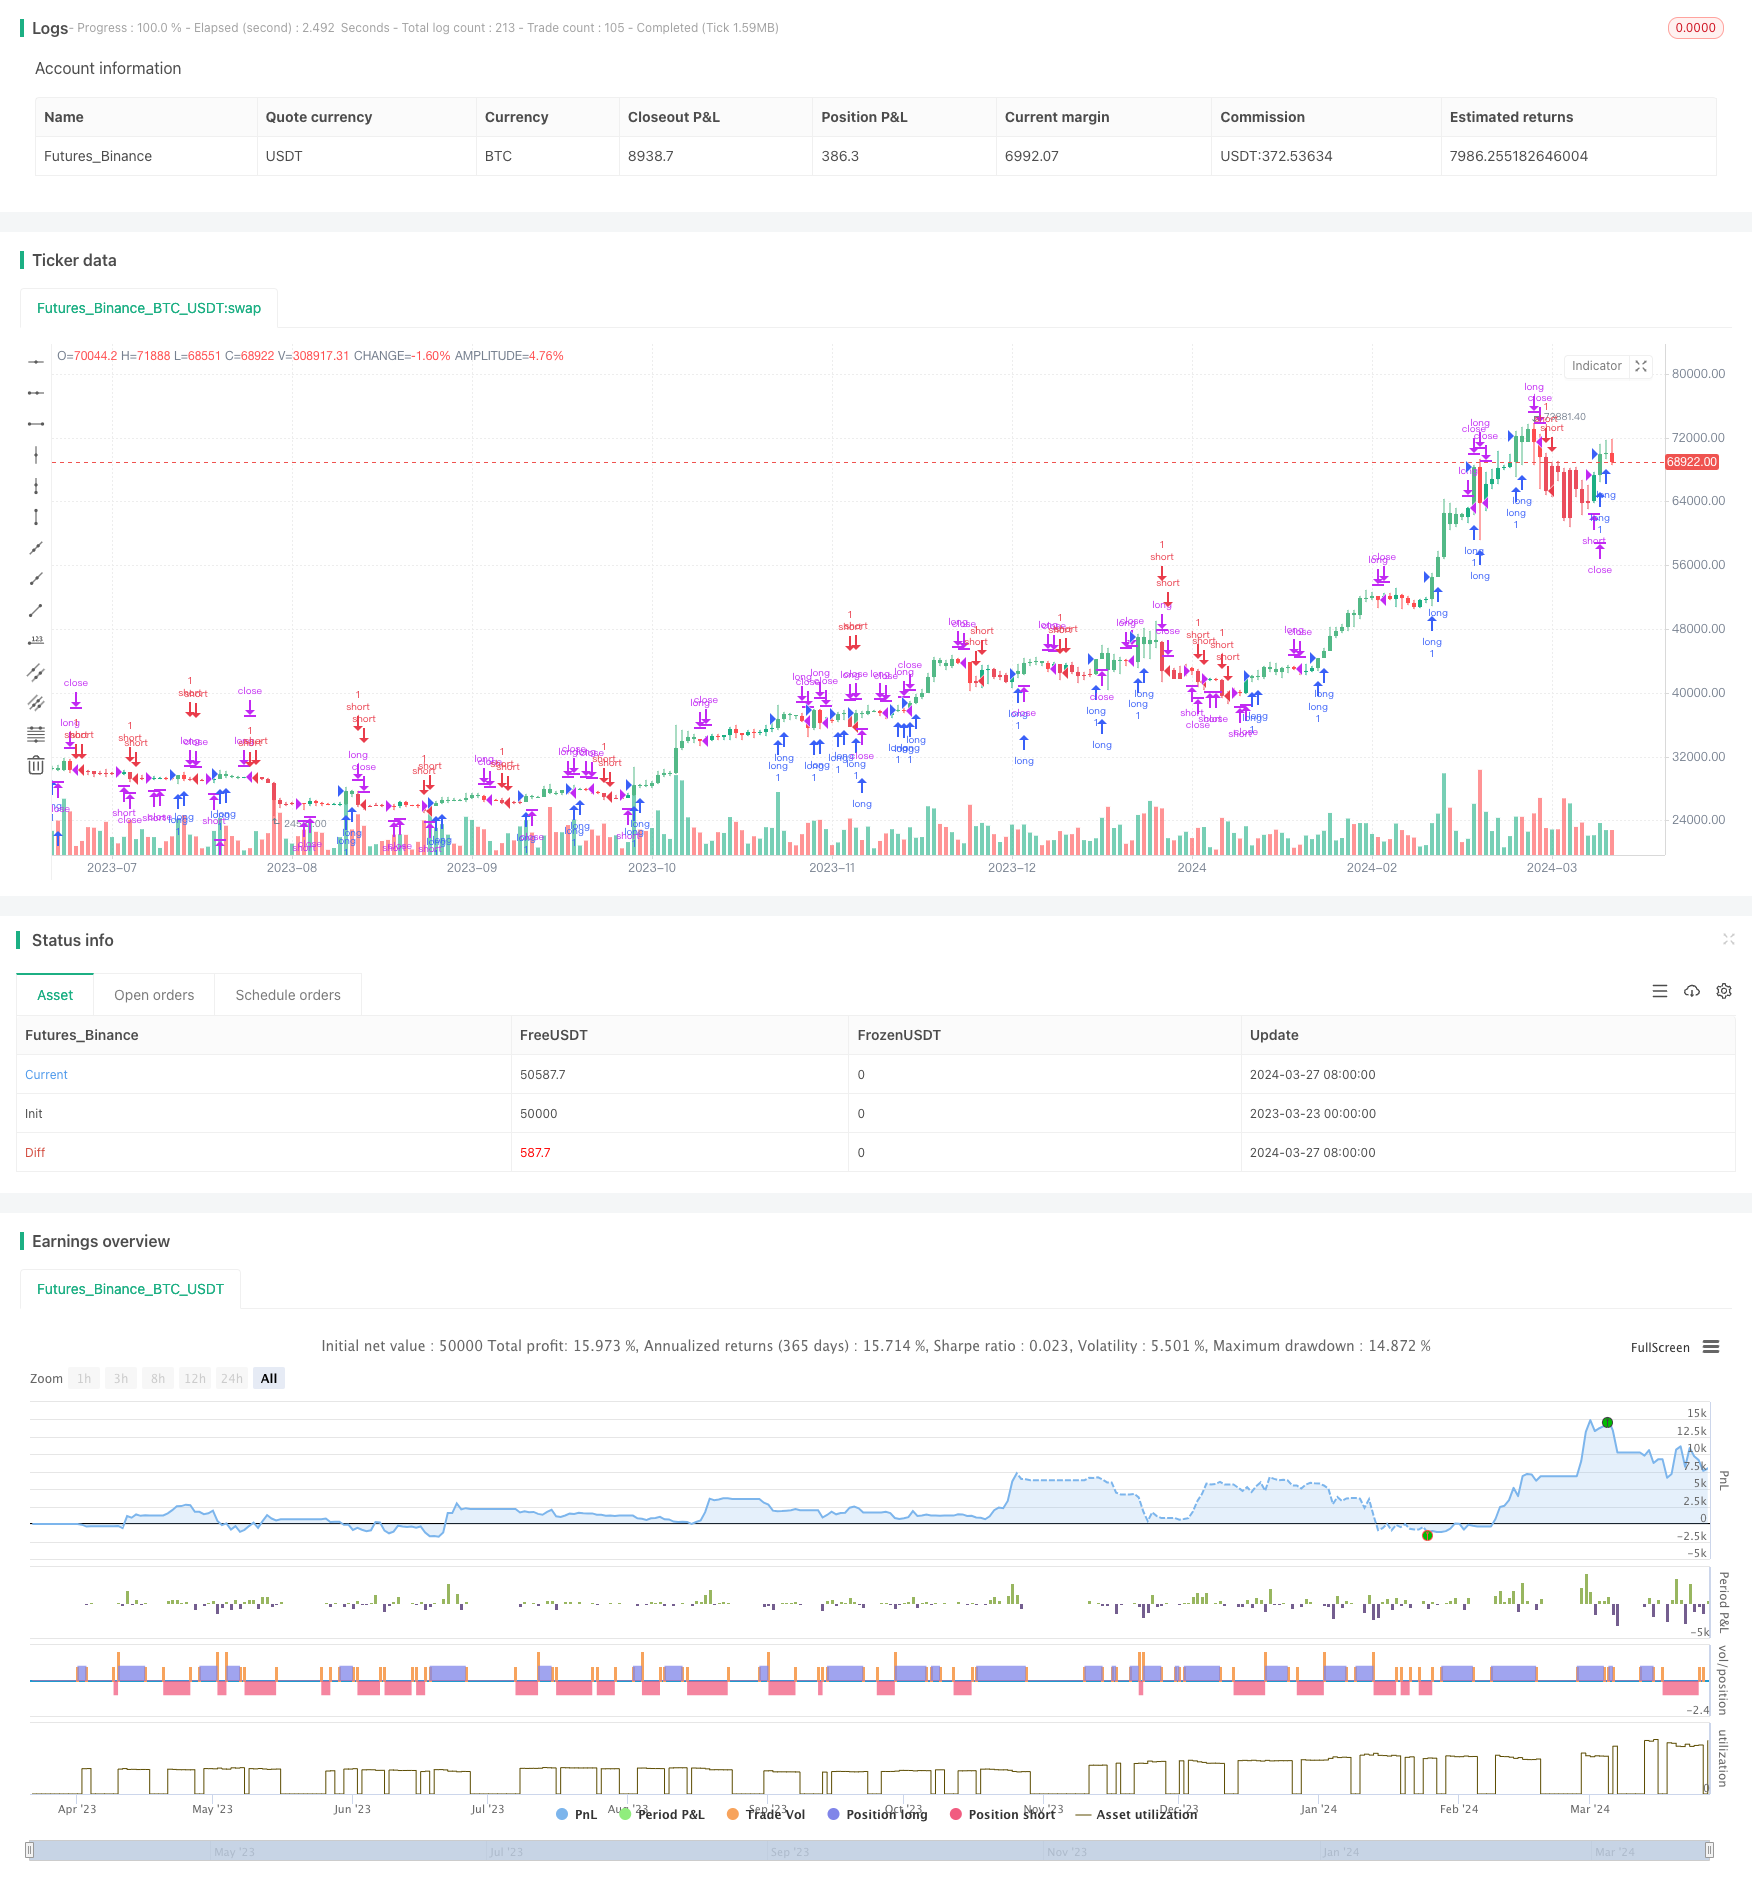
/*backtest
start: 2023-03-23 00:00:00
end: 2024-03-28 00:00:00
period: 1d
basePeriod: 1h
exchanges: [{"eid":"Futures_Binance","currency":"BTC_USDT"}]
*/

//@version=4
strategy("MACD trendfollow", shorttitle="MACD TF", overlay=true)
// switch = input(true, title="Enable MACD Bar Color")
// X001TK MACD trendfollow Strategy
//
//
// This strategy combines the non standart approach in MACD strategy to buy once to buy when the MACD value goes above Signal line and a zero line, to sell on the opposite condition.
//
//
// This strategy goes long if the MACD (3,9,5) goes above its Signal and above zero
//
// You can set Stop loss on the recent lowest low when long position is opened and recent highest hugh in short
//
//
// Exit rule is simple. We close the LONG position once MACD goes below Signal line and close SHORT on the opposite condition
//
//
//
//
// Input
fastMAlen = input(3, minval=1, title="MACD fast moving average")
slowMAlen = input(9,minval=1, title="MACD slow moving average")
signalMACDlen = input(5,minval=1, title="MACD signal line moving average")
// switch = input(true, title="Enable MACD Bar Color")
length = input(1, minval=1)


// === INPUT BACKTEST RANGE ===
FromMonth = input(defval = 1, title = "From Month", minval = 1, maxval = 12)
FromDay   = input(defval = 1, title = "From Day", minval = 1, maxval = 31)
FromYear  = input(defval = 2002, title = "From Year", minval = 2000)
ToMonth   = input(defval = 3, title = "To Month", minval = 1, maxval = 12)
ToDay     = input(defval = 1, title = "To Day", minval = 1, maxval = 31)
ToYear    = input(defval = 2029, title = "To Year", minval = 2017)


// === FUNCTION EXAMPLE ===
start     = timestamp(FromYear, FromMonth, FromDay, 00, 00)  // backtest start window
finish    = timestamp(ToYear, ToMonth, ToDay, 00, 00)        // backtest finish window
window()  => true // create function "within window of time"

// MACD Calculation
MACD = ema(close, fastMAlen) - ema(close, slowMAlen)
signalMACD = ema(MACD, signalMACDlen)
delta = MACD - signalMACD
fastMA = ema(close,fastMAlen)
slowMA = ema(close,slowMAlen)


// Colors
//bartrendcolor = MACD > signalMACD and MACD > 0? green : MACD < signalMACD and MACD < 0? red : MACD < signalMACD? gray :  gray
//barcolor(switch?bartrendcolor:na)

barcolour=(MACD > signalMACD and MACD > 0)?#53B987:(MACD < signalMACD and MACD < 0)?#EB4D5C:na
barcolor(color=barcolour)


// === STRATEGY ===
// conditions

longCond =  MACD > signalMACD and MACD > 0
XlongCond = MACD < signalMACD
ShortCond = MACD < signalMACD and MACD < 0
XShortCond = MACD > signalMACD


strategy.entry("long", strategy.long, when=longCond==true and window()==true )
//strategy.exit(id="Close Long", stop=longStop)//, limit=longTake)
strategy.close("long", when=XlongCond==true and window()==true)
strategy.entry("short", strategy.short,  when=ShortCond==true and window()==true )
//strategy.exit(id="Close Short", stop=shortStop)//, limit=shortTake)
strategy.close("short", when=XShortCond==true and window()==true)

// === /STRATEGY ===