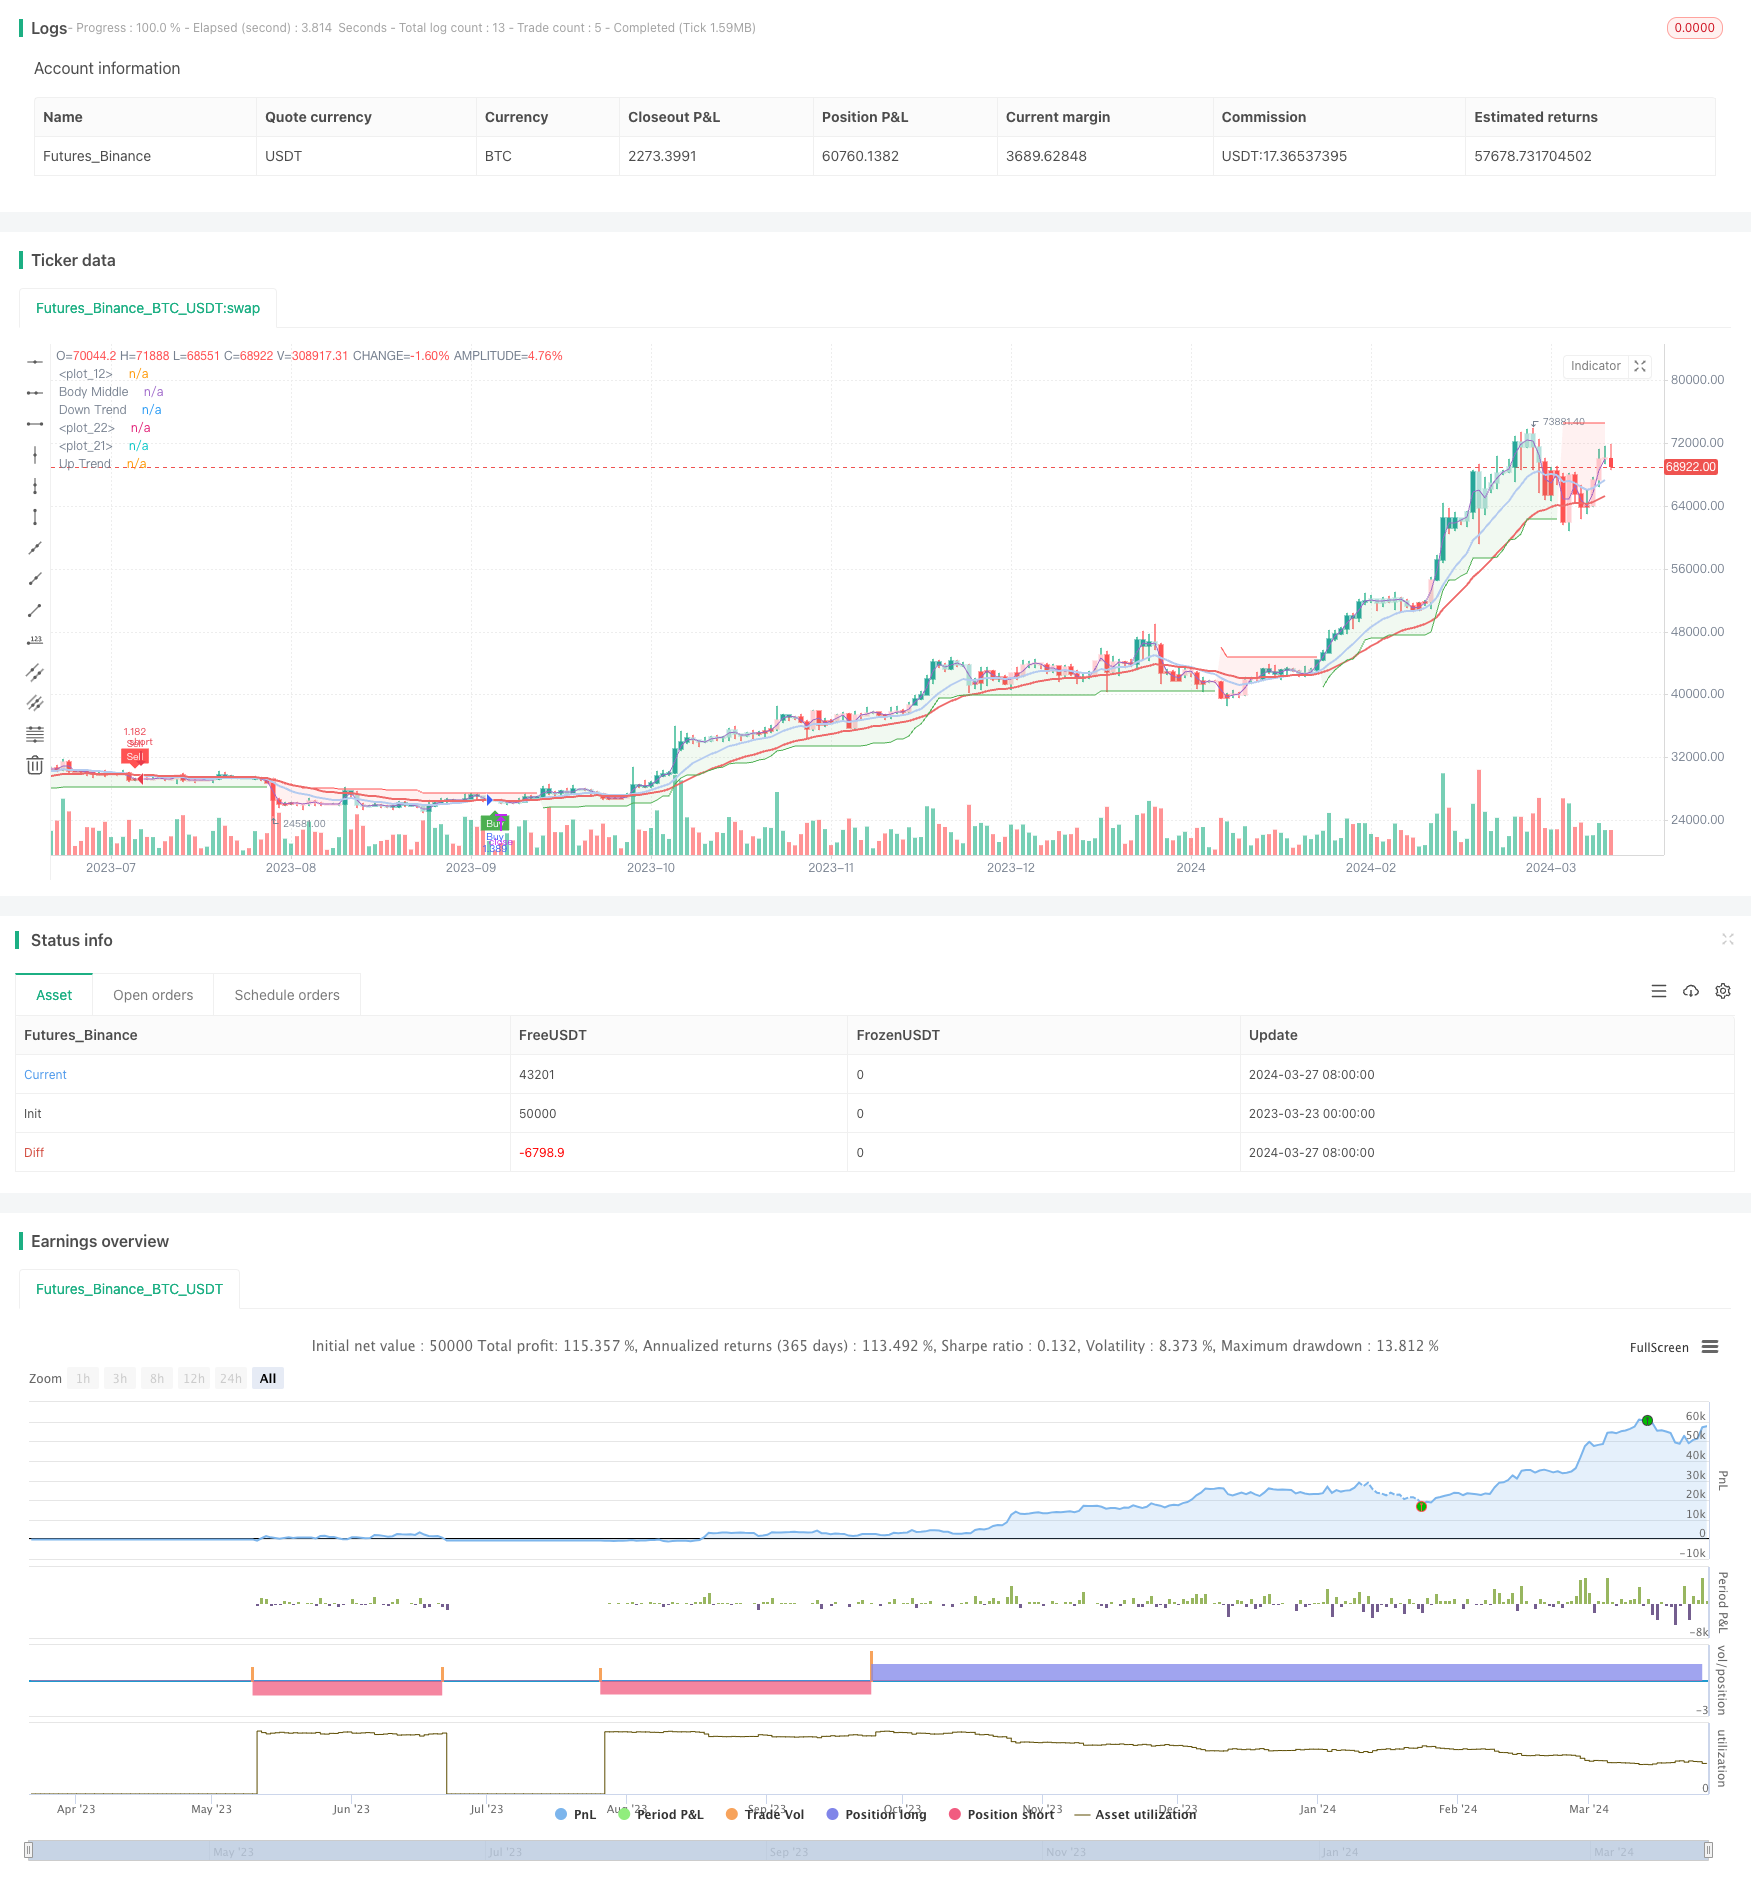
概述
该策略综合运用了多个技术指标,包括指数移动平均线(EMA)、移动平均线收敛发散指标(MACD)、SuperTrend、平均方向指数(ADX)和平均真实波幅(ATR),通过这些指标的组合来判断市场趋势、波动性和交易信号,以期在加密货币交易中获得良好的回报。该策略利用了不同指标的优势,力求在趋势判断、震荡判断和风险控制等方面实现平衡,从而为交易者提供可靠的交易信号。
策略原理
- 使用12日和26日EMA的交叉作为趋势判断的依据,当12日EMA上穿26日EMA时表明上升趋势,反之则表明下降趋势。
- 利用MACD指标作为辅助判断,当MACD直方图大于0时,结合EMA多头信号进行开仓;当MACD直方图小于0时,结合EMA空头信号进行开仓。
- 通过ADX指标判断市场是否处于趋势状态,当ADX大于15时认为市场处于趋势期。
- 使用ATR指标对市场波动性进行判断,当ATR大于20日ATR的0.5倍时,认为市场处于高波动状态。
- 引入SuperTrend指标作为止损条件,当价格跌破SuperTrend时平多头仓位,当价格突破SuperTrend时平空头仓位。
- 在满足EMA、MACD、ADX和ATR条件时,根据多头或空头信号进行开仓;在触发SuperTrend止损条件时进行平仓。
策略优势
- 多指标组合:该策略综合运用了多个技术指标,从趋势、震荡和风险控制等多个维度对市场进行分析,提高了交易信号的可靠性。
- 趋势判断:通过EMA和MACD的结合,策略能够较好地判断市场的趋势方向,为交易决策提供依据。
- 风险控制:引入ADX和ATR指标,对市场的趋势强度和波动性进行判断,在一定程度上控制了交易风险。
- 止损机制:使用SuperTrend指标作为止损条件,能够有效地限制单笔交易的最大亏损,保护交易资金。
- 参数灵活:该策略中的各项指标参数可以根据不同的市场状况和交易品种进行灵活调整,以适应变化的市场环境。
策略风险
- 参数优化:该策略涉及多个指标和参数,如EMA周期、MACD参数、ADX阈值等,这些参数的选择对策略效果有重要影响,需要进行反复的参数优化和调试。
- 市场适应性:该策略在某些市场状况下可能表现欠佳,如震荡市或趋势转折点,此时策略可能会发出错误的交易信号。
- 滑点和交易成本:该策略在高波动市场中可能产生较为频繁的交易信号,导致较高的滑点和交易成本,影响策略收益。
- 回测局限性:该策略的回测结果可能存在一定的局限性,实际交易中的市场状况可能与历史数据存在差异,策略在实盘运行中的表现可能与回测结果不完全一致。
策略优化方向
- 动态参数优化:针对不同的市场状况和交易品种,对策略中的关键参数进行动态优化,提高策略的适应性和稳健性。
- 引入市场情绪指标:在现有指标的基础上,引入反映市场情绪的指标,如恐慌指数(VIX)等,对市场情绪进行量化分析,辅助交易决策。
- 改进止损机制:在SuperTrend止损的基础上,引入其他止损方法,如移动止损、百分比止损等,提高止损的灵活性和有效性。
- 仓位管理优化:根据市场趋势强度、波动性等因素,动态调整仓位大小,在趋势明确时加大仓位,在震荡市中减小仓位,提高资金利用效率。
- 多时间框架分析:结合不同时间框架的信号,如日线、4小时线等,对交易信号进行多重确认,提高信号的可靠性。
总结
EMA-MACD-SuperTrend-ADX-ATR多重指标交易信号策略是一个综合运用多个技术指标的量化交易策略。通过EMA、MACD、ADX和ATR等指标的组合,策略能够从趋势、震荡和风险控制等多个维度对市场进行分析,为交易者提供可靠的交易信号。该策略的优势在于多指标组合、趋势判断、风险控制和止损机制等方面,但同时也存在参数优化、市场适应性、交易成本和回测局限性等风险。未来可以通过动态参数优化、引入市场情绪指标、改进止损机制、仓位管理优化和多时间框架分析等方面对策略进行优化和改进,以提高其适应性、稳健性和盈利能力。
策略源码
/*backtest
start: 2023-03-23 00:00:00
end: 2024-03-28 00:00:00
period: 1d
basePeriod: 1h
exchanges: [{"eid":"Futures_Binance","currency":"BTC_USDT"}]
*/

//@version=5
strategy("EMA-MACD-SuperTrend-ADX-ATR Strategy",
     overlay = true,
     initial_capital = 1000,
     default_qty_type = strategy.percent_of_equity,
     default_qty_value = 70)

//MACD
[macdLine, signalLine, hist] = ta.macd(close, 12, 26, 9)
//Plot Candlesticks
candlestickscolor = (hist >= 0 ? (hist[1] < hist ? #26A69A : #B2DFDB) : (hist[1] < hist ? #FFCDD2 : #FF5252))
plotcandle(open, high, low, close,
     color = candlestickscolor,
     bordercolor = candlestickscolor)

//EMA
ema12 = ta.ema(close, 12)
ema26 = ta.ema(close, 26)

//Plot EMA
plot(ema26, color= #EE6969, linewidth = 2)
plot(ema12, color= #B4CBF0, linewidth = 2)

//Average Directional Index (ADX) Calculation
trueRange = ta.rma(ta.tr, 14)
plusDM = ta.rma(math.max(high - high[1], 0), 14)
minusDM = ta.rma(math.max(low[1] - low, 0), 14)
plusDI = 100 * ta.rma(plusDM / trueRange, 14)
minusDI = 100 * ta.rma(minusDM / trueRange, 14)
adxValue = 100  *ta.rma(math.abs(plusDI - minusDI) / (plusDI + minusDI), 14)

//Trend Confirmation (ADX)
trending = adxValue > 15

//Volatility Filter (ATR)
atrValue = ta.atr(14)
volatility = atrValue > 0.5 * ta.atr(20)

//SuperTrend
atrlength = input.int(10, "ATR Length", step = 1)
factor = input.float(3, "Factor", step = 0.1)
[supertrend, direction] = ta.supertrend(factor, atrlength)
supertrend := barstate.isfirst ? na : supertrend

//Plot SuperTrend
uptrend = plot(direction < 0 ? supertrend : na,
     "Up Trend", color = color.green, style = plot.style_linebr, linewidth = 1)

downtrend = plot(direction > 0 ? supertrend : na,
     "Down Trend", color = color.red, style = plot.style_linebr, linewidth = 1)
bodymiddle = plot(barstate.isfirst ? na : (open + close)/2, "Body Middle", display = display.none)
fill(bodymiddle, uptrend,   color.new(color.green, 90), fillgaps = false)
fill(bodymiddle, downtrend, color.new(color.red,   90), fillgaps = false)

//Entry Conditions
longCondition = ta.crossover(ema12, ema26) and trending and volatility and hist > 0

shortCondition = ta.crossunder(ema12, ema26)  and trending and volatility and hist < 0

long_SL_Con = ta.crossunder(close, supertrend)

short_SL_Con = ta.crossover(close, supertrend)

//Plot Signal
plotshape(longCondition,
     title='Buy', text='Buy',
     location= location.belowbar,
     style=shape.labelup, size=size.tiny,
     color=color.green, textcolor=color.new(color.white, 0))

plotshape(shortCondition,
     title='Sell', text='Sell',
     location= location.abovebar,
     style=shape.labeldown, size=size.tiny,
     color=color.red, textcolor=color.new(color.white, 0))

//Backtest
start = timestamp(2020, 1, 1, 0, 0, 0)
end = timestamp(2024, 1, 1, 0, 0, 0)
backtestperiod = time >= start and time <= end

if longCondition and backtestperiod
    strategy.entry("Buy", strategy.long)

if long_SL_Con and backtestperiod
    strategy.close("Buy")

if shortCondition and backtestperiod
    strategy.entry("Sell", strategy.short)

if short_SL_Con and backtestperiod
    strategy.close("Sell")