概述
该策略基于修正的相对强弱指数(Modified RSI)来捕捉市场趋势。策略的主要思路是利用Modified RSI指标的交叉信号和直方图信号来判断市场趋势,并根据趋势方向进行交易。
策略原理
- 计算价格的EMA作为Modified RSI的输入
- 计算Modified RSI指标
- 计算Modified RSI的EMA作为信号线
- 计算Modified RSI和信号线的差值作为直方图
- 当Modified RSI上穿信号线且直方图大于0时,产生买入信号
- 当Modified RSI下穿信号线且直方图小于0时,产生卖出信号
策略优势
- Modified RSI指标相比传统RSI指标,能更好地捕捉趋势
- 结合Modified RSI的交叉信号和直方图信号,能有效过滤假信号
- 参数可调,适用于不同的市场和周期
- 程序简洁,计算效率高
策略风险
- Modified RSI指标在震荡市容易产生错误信号
- 趋势转折点的捕捉可能存在滞后
- 单一指标容易受到价格噪音干扰
策略优化方向
- 可以结合其他趋势指标如移动平均线等,提高信号可靠性
- 可以加入止损止盈模块,控制单笔交易风险
- 可以根据不同市场特点,优化参数
- 可以加入仓位管理模块,动态调整仓位
总结
该策略利用Modified RSI指标的特性,从趋势跟踪的角度构建交易系统。Modified RSI指标克服了传统RSI指标的部分缺陷,趋势捕捉能力相对较强。但是单一指标的策略往往存在局限性,需要结合其他技术手段来改进。通过优化策略参数、丰富信号来源、加入风控模块等方法,可以进一步提升该策略的稳定性和盈利能力。
策略源码
/*backtest
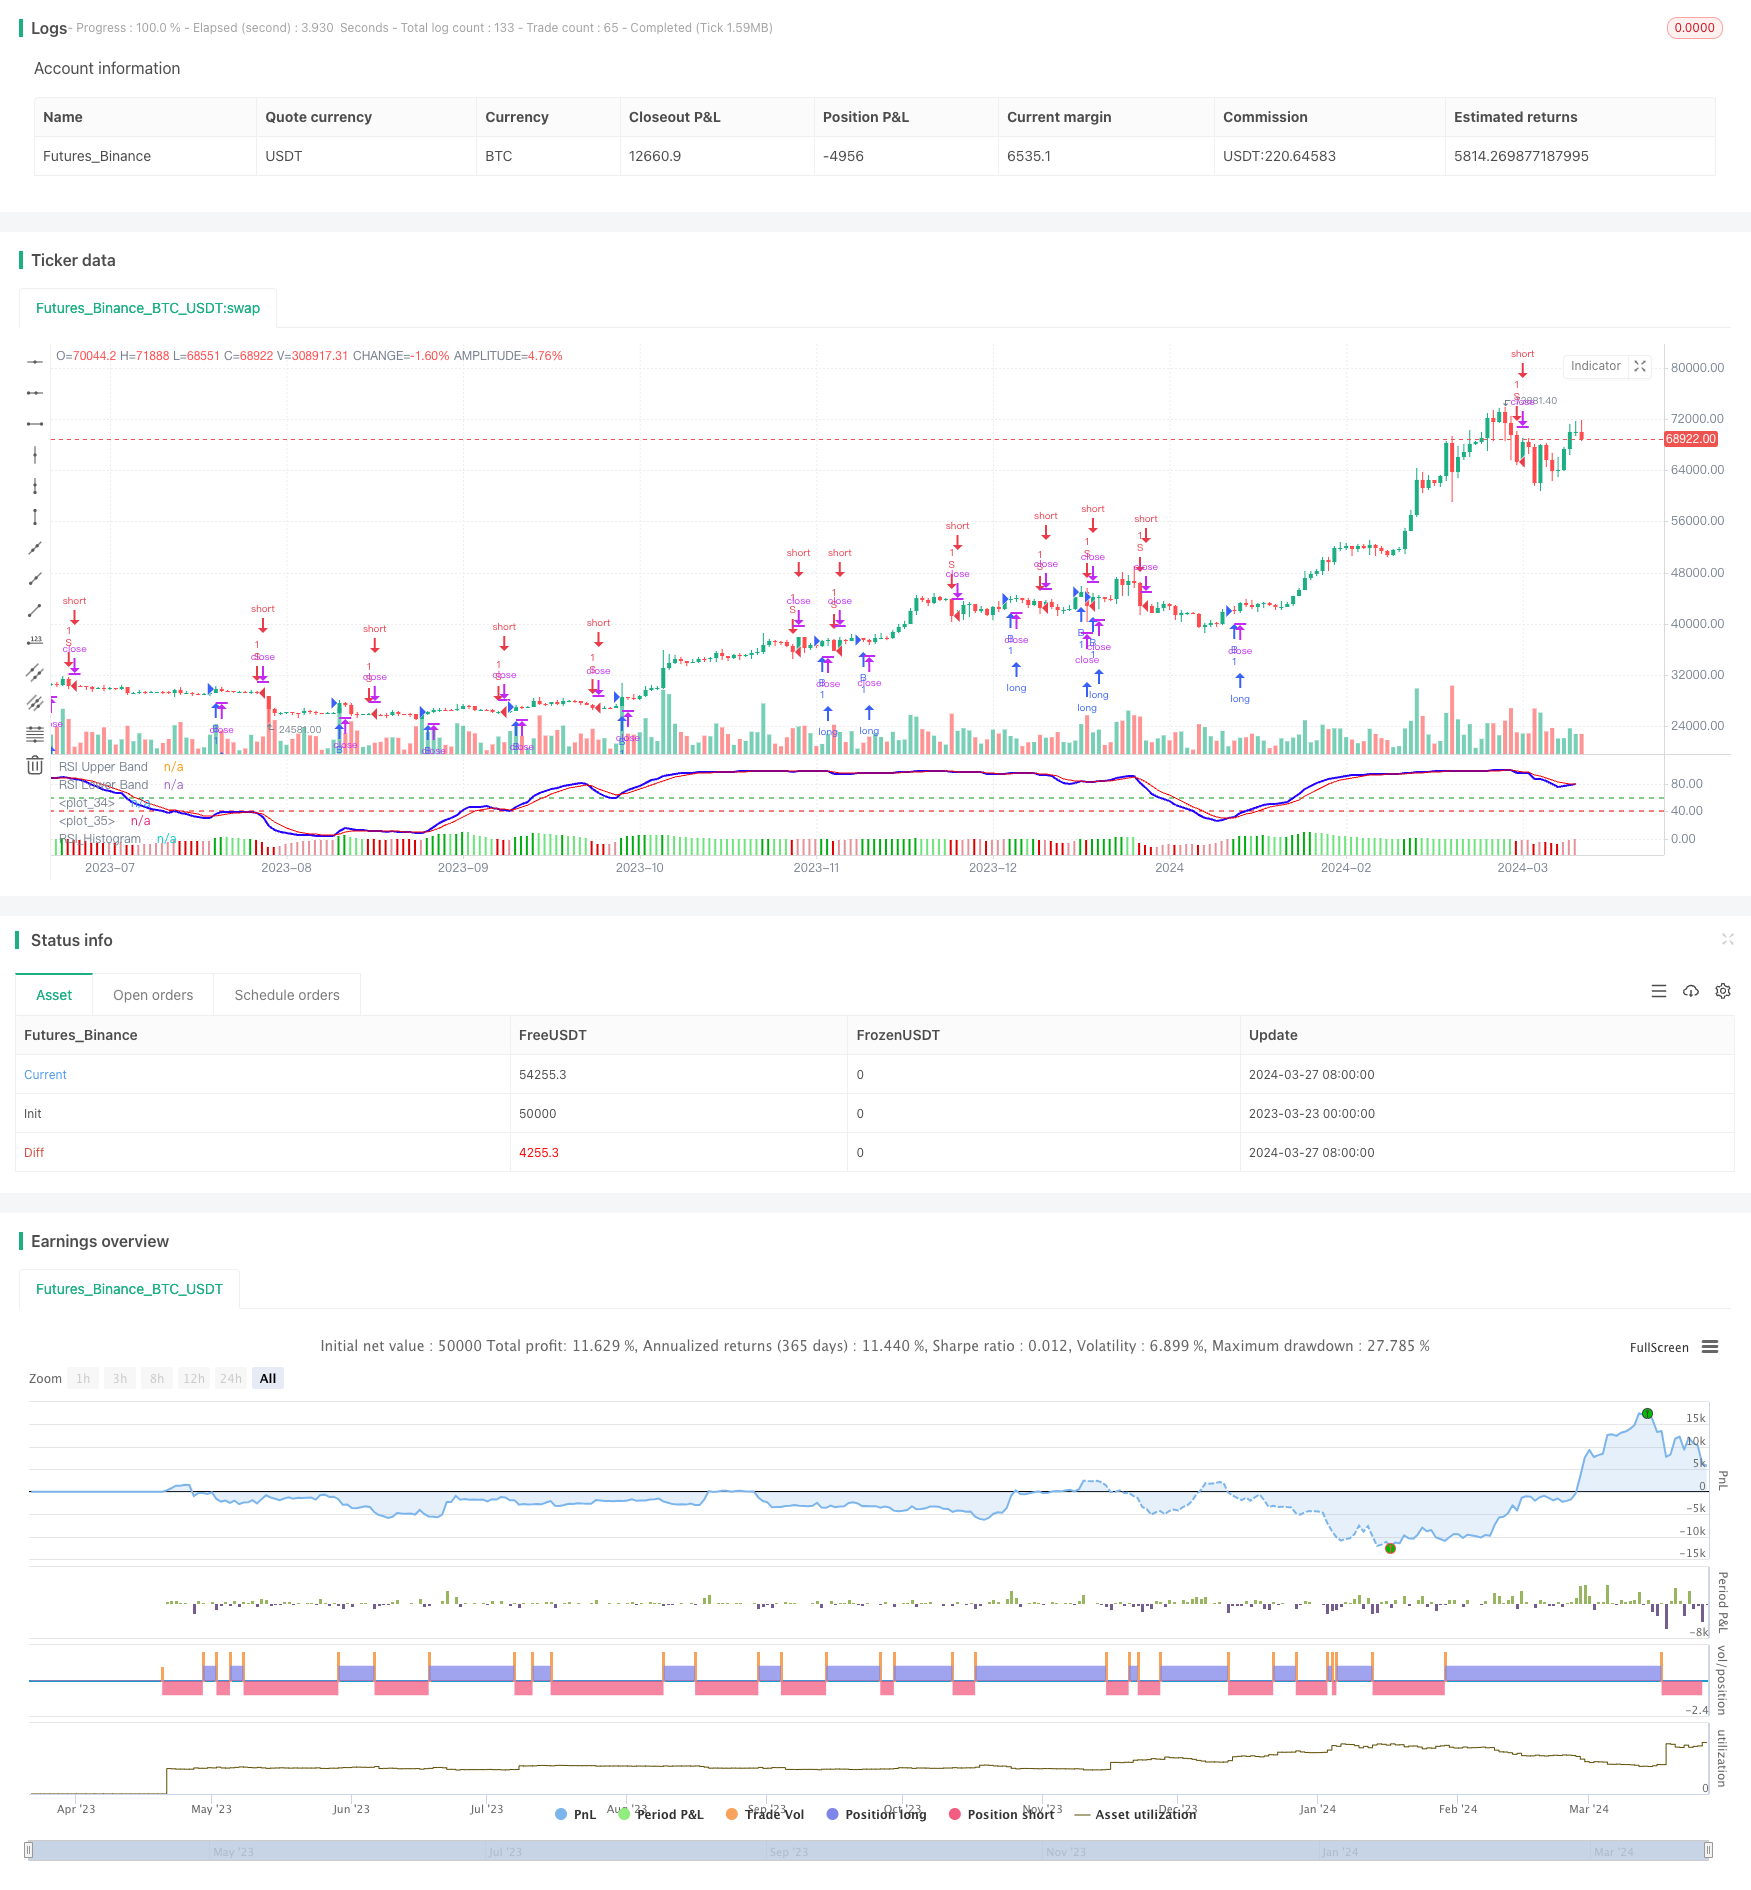
start: 2023-03-23 00:00:00
end: 2024-03-28 00:00:00
period: 1d
basePeriod: 1h
exchanges: [{"eid":"Futures_Binance","currency":"BTC_USDT"}]
*/
// This source code is subject to the terms of the Mozilla Public License 2.0 at https://mozilla.org/MPL/2.0/
// © YogirajDange
//@version=5
// Verical lines
// // Define the times
// t1 = timestamp(year, month, dayofmonth, 09, 15) // 9:15
// t2 = timestamp(year, month, dayofmonth, 11, 15) // 11:15
// t3 = timestamp(year, month, dayofmonth, 13, 15) // 1:15
// t4 = timestamp(year, month, dayofmonth, 15, 25) // 3:25
// // Check if the current bar is on the current day
// is_today = (year(time) == year(timenow)) and (month(time) == month(timenow)) and (dayofmonth(time) == dayofmonth(timenow))
// // Draw a vertical line at each time
// if is_today and (time == t1 or time == t2 or time == t3 or time == t4)
// line.new(x1 = bar_index, y1 = low, x2 = bar_index, y2 = high, extend = extend.both, color=color.red, width = 1)
strategy('Modified RSI')
col_grow_above = input(#02ac11, "Above Grow", group="Histogram", inline="Above")
col_fall_above = input(#6ee47d, "Fall", group="Histogram", inline="Above")
col_grow_below = input(#e5939b, "Below Grow", group="Histogram", inline="Below")
col_fall_below = input(#dd0000, "Fall", group="Histogram", inline="Below")
EMA_length = input.int(13, 'Price_EMA', minval=1)
RSI_length = input.int(14, 'RSI_Period', minval=1)
Avg_length = input.int(5, 'RSI_Avg_EMA', minval=1)
fastMA = ta.ema(close, EMA_length)
modrsi = ta.rsi(fastMA, RSI_length)
RSIAVG = ta.ema(modrsi, Avg_length)
plot(modrsi, color=color.rgb(38, 0, 255), linewidth=2)
plot(RSIAVG, color=color.rgb(247, 0, 0))
rsiUpperBand = hline(60, 'RSI Upper Band', color=#099b0e)
//hline(50, "RSI Middle Band", color=color.new(#787B86, 50))
rsiLowerBand = hline(40, 'RSI Lower Band', color=#e90101)
RSI_hist = modrsi - RSIAVG
//plot(RSI_hist,"RSI_Histogram", color = #c201e9, style = plot.style_columns,linewidth= 5)
plot(RSI_hist, title="RSI_Histogram", style=plot.style_columns, color=(RSI_hist>=0 ? (RSI_hist[1] < RSI_hist ? col_grow_above : col_fall_above) : (RSI_hist[1] < RSI_hist ? col_grow_below : col_fall_below)))
/////// Moving Averages 20 50 EMA
fast_ma = input.int(20, minval=2, title="Fast_EMA")
slow_ma = input.int(50, minval=2, title="Slow_EMA")
src = input.source(close, title="Source")
out = ta.ema(src, fast_ma)
out1 = ta.ema(src, slow_ma)
//plot(out, title="20 EMA", color=color.rgb(117, 71, 247), linewidth = 2)
//plot(out1, title="50 EMA", color=color.rgb(0, 0, 0), linewidth = 2)
longCondition = ((ta.crossover(modrsi, RSIAVG)) and (RSI_hist > 0))
if longCondition
strategy.entry('B', strategy.long)
shortCondition = ((ta.crossunder(modrsi, RSIAVG)) and (RSI_hist < 0))
if shortCondition
strategy.entry('S', strategy.short)