Marcus' Trend Trader with Arrows and Alerts Strategy

Overview
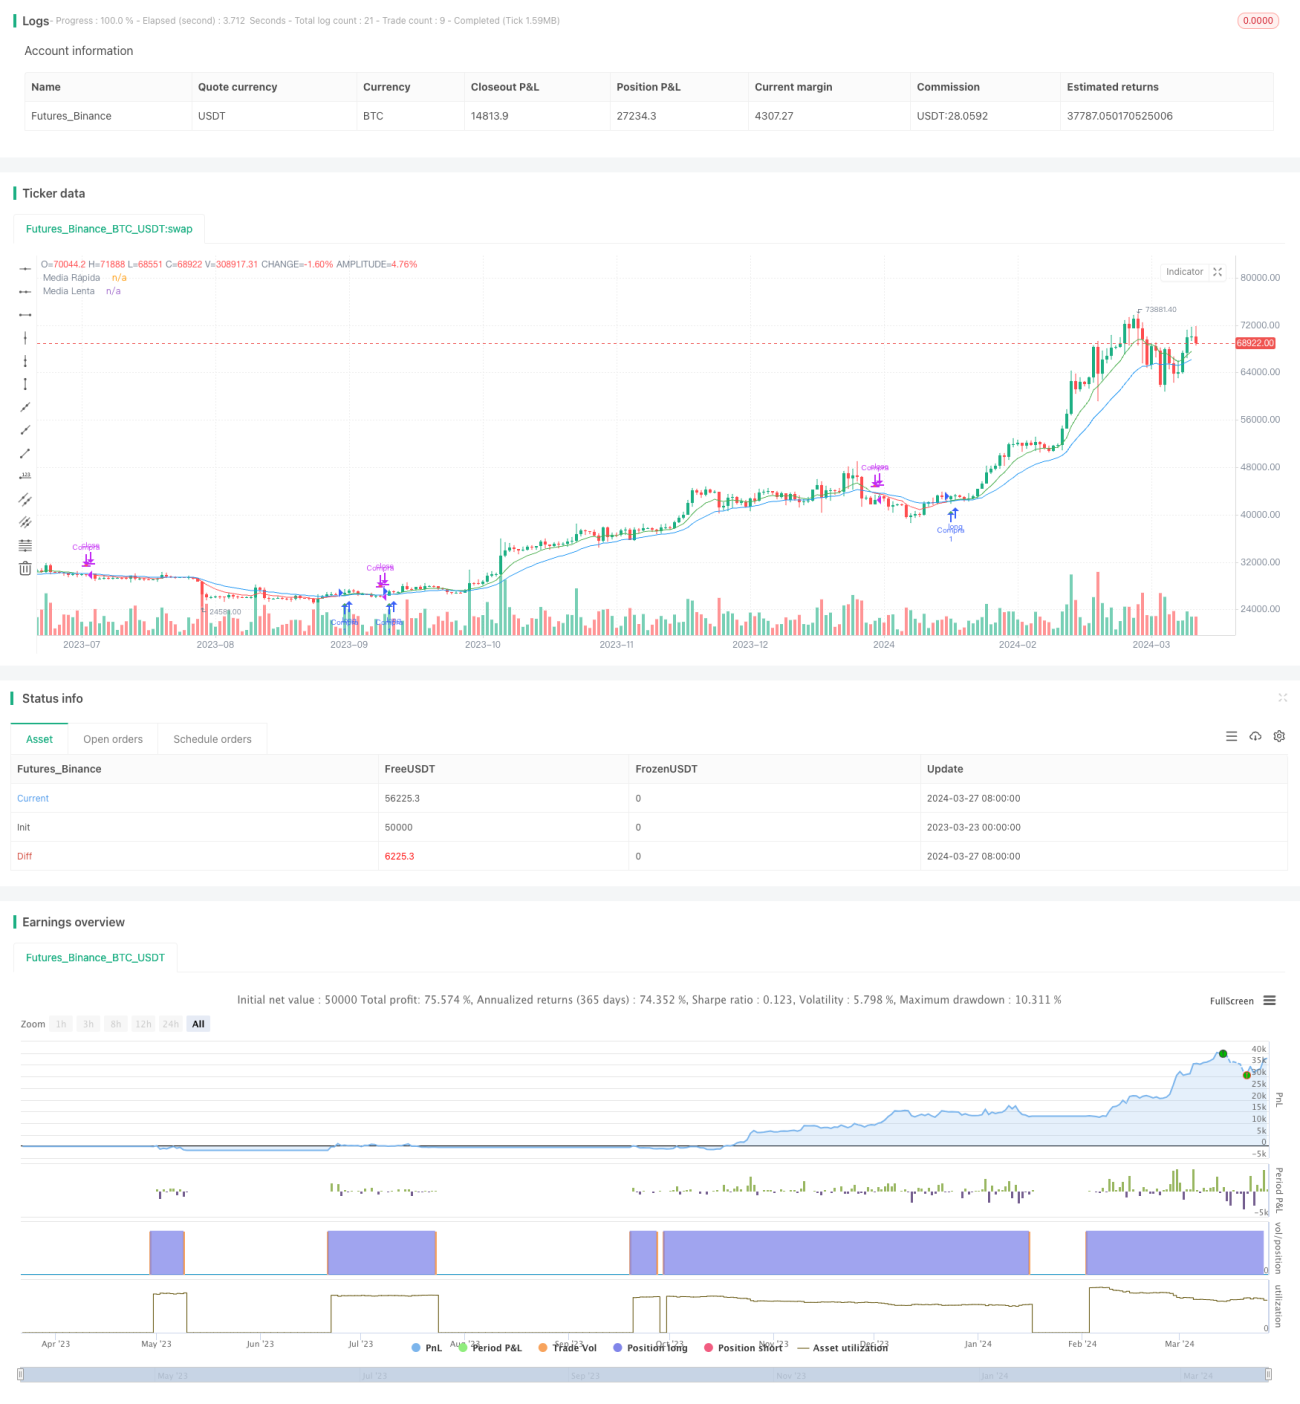
This strategy is designed for cryptocurrency markets, combining the Trend Trader concept with EMA crossovers for clear entry and exit signals. It utilizes two EMAs (Exponential Moving Averages) with customizable lengths to identify market trends. Buy signals are generated when the fast EMA crosses above the slow EMA, and sell signals are triggered when the fast EMA crosses below the slow EMA. Additionally, it includes visual arrow indicators and alert conditions for real-time trading notifications, enhancing the decision-making process for traders.
Strategy Principles
The strategy uses two EMAs as its core components: a fast EMA and a slow EMA. The lengths of these EMAs can be customized through input parameters to accommodate different trading styles and market conditions. The strategy determines the market trend by comparing the relative positions of the fast EMA and the slow EMA. When the fast EMA is above the slow EMA, it indicates an uptrend, and when the fast EMA is below the slow EMA, it indicates a downtrend.
The strategy uses EMA crossovers to generate buy and sell signals. When the fast EMA crosses above the slow EMA, it indicates the beginning of an uptrend, and the strategy issues a buy signal. Conversely, when the fast EMA crosses below the slow EMA, it indicates the beginning of a downtrend, and the strategy issues a sell signal.
To enhance visual assistance and real-time notifications, the strategy also includes arrow indicators and alert conditions. When a buy signal is generated, a green upward arrow is plotted below the price bar, and when a sell signal is generated, a red downward arrow is plotted above the price bar. Furthermore, when a buy or sell signal is triggered, the strategy sends out corresponding alerts, enabling traders to take timely actions.
Strategy Advantages
-
Simplicity and effectiveness: The strategy employs the simple concept of EMA crossovers to identify trends and generate trading signals, making it easy to understand and implement.
-
Customizable parameters: The strategy allows users to customize the lengths of the fast EMA and the slow EMA to suit different trading styles and market conditions.
-
Visual assistance: The strategy incorporates arrow indicators, providing clear visual cues to help traders quickly identify buy and sell opportunities.
-
Real-time alerts: The strategy has built-in alert conditions that notify traders when buy or sell signals are triggered, enabling them to take timely actions.
-
Trend following: By utilizing EMA crossovers, the strategy effectively identifies and follows market trends, helping traders align with the prevailing market direction.
Strategy Risks
-
Lag: Like all moving average-based strategies, the EMA crossover strategy may generate lagging signals, particularly in fast-moving or highly volatile markets.
-
False signals: Under certain market conditions, such as range-bound markets or lack of clear trends, the strategy may generate false buy or sell signals, leading to unprofitable trades.
-
Parameter sensitivity: The performance of the strategy largely depends on the chosen EMA lengths. Inappropriate parameter selection may result in suboptimal outcomes or missing important trading opportunities.
-
Lack of risk management: The strategy itself does not include any explicit risk management measures, such as stop-losses or position sizing adjustments. Traders need to incorporate other risk management techniques to control potential losses.
Strategy Optimization Directions
-
Combining with other indicators: Consider combining EMA crossovers with other technical indicators, such as the Relative Strength Index (RSI) or Stochastic Oscillator, to confirm trends and generate more reliable trading signals.
-
Introducing adaptive parameters: Implement an adaptive mechanism that dynamically adjusts the EMA lengths based on market volatility or other market characteristics to adapt to changing market conditions.
-
Adding risk management: Introduce explicit risk management measures into the strategy, such as ATR-based stop-losses or volatility-based position sizing, to limit potential losses and optimize risk-reward ratios.
-
Considering multiple timeframes: Analyze EMA crossovers on multiple timeframes to identify stronger and more sustainable trends, enhancing the credibility of trading signals.
-
Backtesting and optimization: Thoroughly backtest the strategy under various market conditions and optimize parameters using historical data before implementation to improve its performance in real trading environments.
Summary
Marcus' Trend Trader with Arrows and Alerts Strategy is a simple yet effective approach for identifying trends and generating trading signals in cryptocurrency markets. By utilizing customizable EMA crossovers, visual arrow indicators, and real-time alerts, the strategy provides traders with an intuitive framework to spot potential buy and sell opportunities. However, like all trading strategies, it is not without limitations, and traders should be aware of its potential drawbacks, such as signal lag and the possibility of false signals. By combining the strategy with other technical indicators, introducing risk management measures, and properly backtesting and optimizing it, its performance and reliability can be further improved. Overall, Marcus' Trend Trader with Arrows and Alerts Strategy offers a valuable tool for traders seeking to follow trends and take timely actions in the cryptocurrency markets.
- 1