Volatility Trend Following Strategy

Overview
The Volatility Trend Following Strategy combines volatility analysis and trend following techniques to capture price movements influenced by market volatility while effectively identifying and riding trends. The strategy dynamically adjusts trend following parameters using the ATR indicator to adapt to changing market environments and more effectively capture trends. It offers customizable parameters such as length and deviation for Bollinger Bands, as well as the option to use or bypass the volatility filter, providing flexibility for traders. The strategy provides clear visualization of trend lines, buy/sell signals, and volatility-based filters, making it easier for traders to interpret signals and make informed trading decisions.
Strategy Principles
The core principle of this strategy is to combine volatility analysis with trend following. It uses the ATR indicator to adjust trend following parameters to adapt to different market volatility environments. During periods of high volatility, the strategy widens the trend lines accordingly to avoid frequent false signals, while during periods of low volatility, it narrows the trend lines to capture trend changes more sensitively.
The strategy uses Bollinger Bands to determine the trend direction. When the closing price breaks above the upper band, it indicates an uptrend, and when the closing price breaks below the lower band, it indicates a downtrend. The strategy dynamically adjusts the width of the Bollinger Bands (based on ATR) to adapt to different market volatility levels.
Once the trend direction is determined, the strategy uses trend lines to generate trading signals. When the trend shifts from downward to upward, the strategy issues a buy signal, and when the trend shifts from upward to downward, it issues a sell signal. This approach effectively captures trends while reducing false signals through the volatility filter.
Strategy Advantages
-
Dynamic Adaptability: The strategy dynamically adjusts trend following parameters using the ATR indicator to adapt to changing market environments, enhancing the effectiveness of trend capture.
-
Reduced False Signals: By incorporating volatility analysis, the strategy filters out noise and false signals during periods of low volatility, improving signal accuracy.
-
Flexibility: The strategy offers customizable parameters such as Bollinger Bands length, deviation, and the option to use or bypass the volatility filter, allowing traders to adjust based on their risk tolerance and market preferences.
-
Clear Visualization: The strategy provides clear visualization of trend lines, buy/sell signals, and volatility-based filters, making it easier for traders to interpret signals and make informed trading decisions.
Strategy Risks
-
Parameter Sensitivity: The performance of the strategy largely depends on the selection of parameters for Bollinger Bands and ATR. Inappropriate parameter settings may lead to suboptimal performance.
-
Trend Recognition Delay: Like all trend following strategies, this strategy has a certain delay in recognizing trend changes. This may result in missing out on a portion of potential profits in the early stages of a trend.
-
Range-Bound Markets: In market environments with low volatility and prices oscillating within a narrow range, the strategy may generate more false signals, leading to frequent trades and potential losses.
Strategy Optimization Directions
-
Parameter Optimization: Optimize the length and deviation of Bollinger Bands and the length of ATR to find the optimal combination of parameters that improves the strategy's performance.
-
Signal Filtering: Introduce additional technical indicators or price behavior patterns, such as RSI or MACD, to further filter trading signals and enhance signal reliability.
-
Dynamic Stop-Loss: Set dynamic stop-loss levels based on ATR or other volatility indicators to better control risk and protect profits.
-
Multi-Timeframe Analysis: Combine trend analysis across different timeframes to confirm the strength and sustainability of trends, enabling more informed trading decisions.
Summary
The Volatility Trend Following Strategy provides traders with a robust framework for navigating dynamic market conditions by combining volatility analysis with trend following. Its ability to adapt to changing market environments, reduce false signals, and provide clear visual cues makes it a valuable tool for traders seeking to capitalize on trending opportunities while effectively managing risk. With further optimization of parameters, improved signal filtering, and dynamic risk management, the strategy has the potential to enhance its performance and reliability.
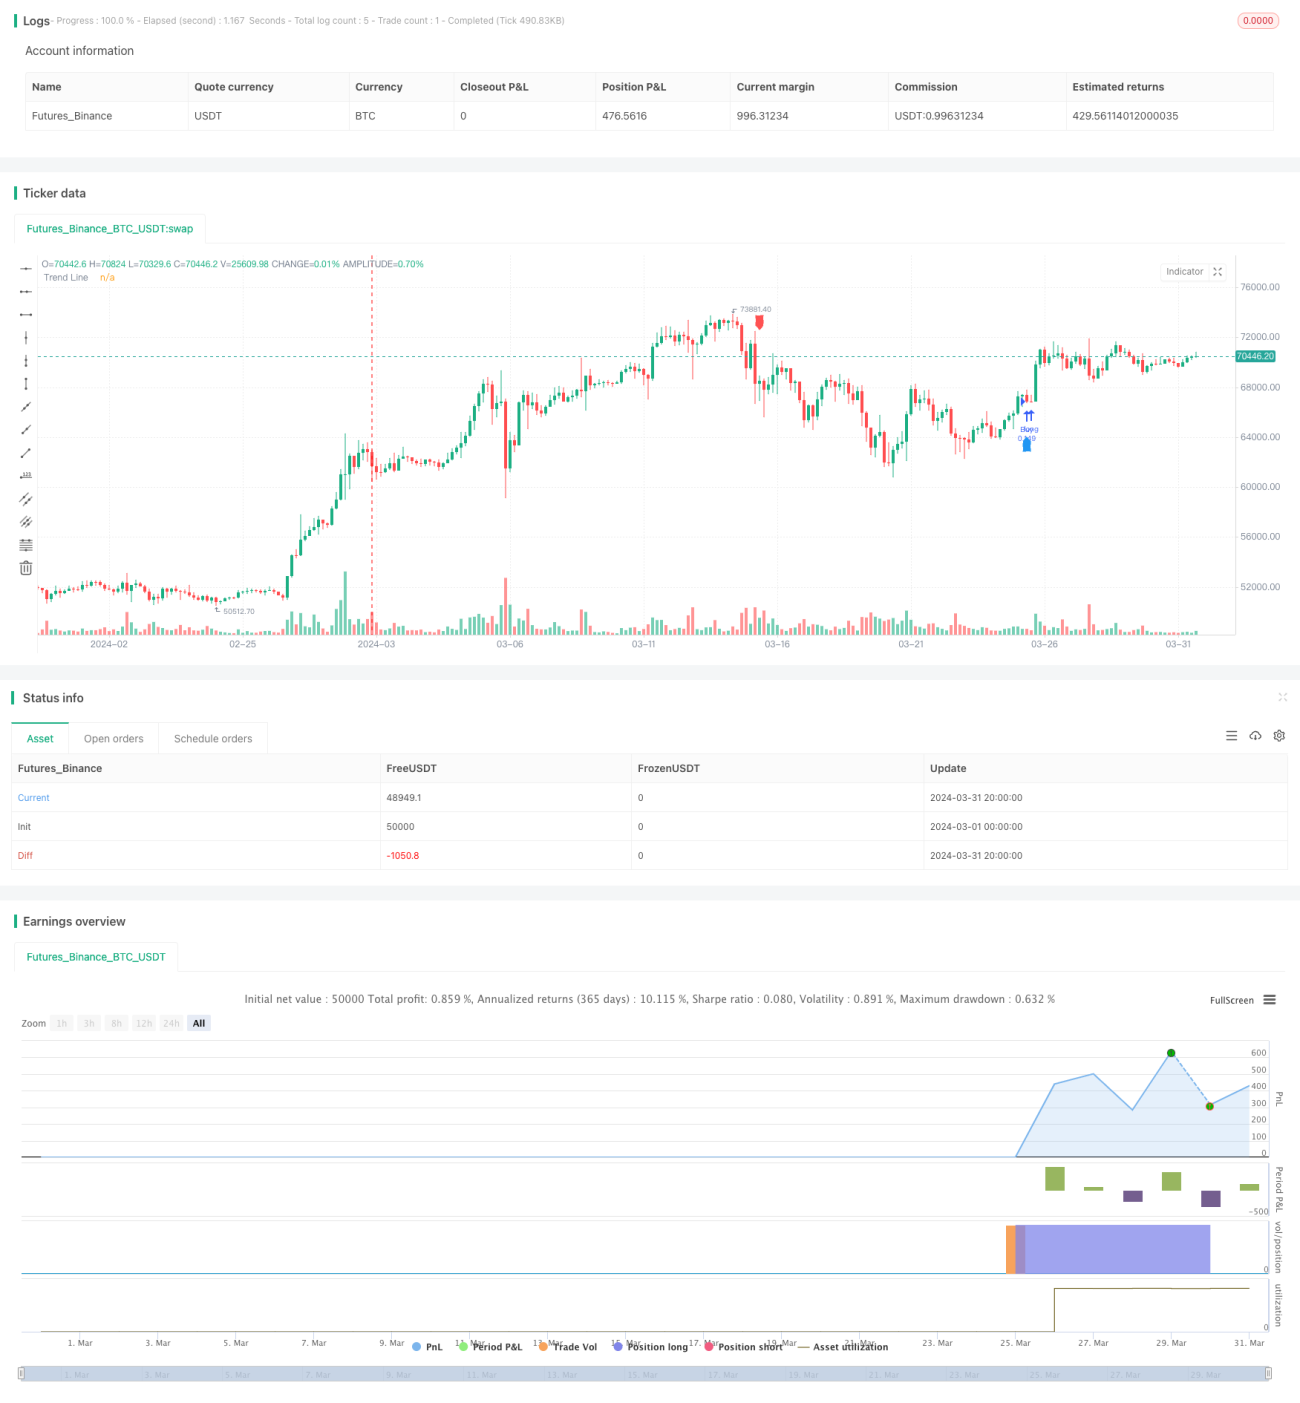
/*backtest
start: 2024-03-01 00:00:00
end: 2024-03-31 23:59:59
period: 4h
basePeriod: 15m
exchanges: [{"eid":"Futures_Binance","currency":"BTC_USDT"}]
*/

// © Julien_Eche

//@version=5
strategy('Volatility Trend Strategy', overlay=true, default_qty_type=strategy.percent_of_equity, default_qty_value=20)- 1