Momentum Trading with Dual Moving Average Crossover Strategy

Author: ChaoZhang, Date: 2024-04-01 11:53:14
Tags:

img

Overview

This strategy employs the 8-period and 21-period Exponential Moving Averages (EMAs) to identify changes in market trends. A buy signal is generated when the shorter-term EMA crosses above the longer-term EMA from below, while a sell signal is generated when the shorter-term EMA crosses below the longer-term EMA from above. The strategy also incorporates three consecutive Higher Lows (HLs) and three consecutive Lower Highs (LHs) as further confirmation of trend reversals. Additionally, stop-loss and take-profit levels are set to manage risk and lock in profits.

Strategy Principles

  1. Calculate the 8-period and 21-period EMAs to identify the primary trend direction.
  2. Identify three consecutive Higher Lows (HLs) and three consecutive Lower Highs (LHs) as early signals of potential trend reversals.
  3. Generate a buy signal when the 8-period EMA crosses above the 21-period EMA and an HL breakout occurs; generate a sell signal when the 8-period EMA crosses below the 21-period EMA and an LH breakout occurs.
  4. Set the stop-loss level at 5% of the entry price and the take-profit level at 16% of the entry price to manage risk and lock in profits.
  5. Close the position and open a reverse position when an opposite signal appears.

Strategy Advantages

  1. Combines EMAs and price action patterns (HLs and LHs) to confirm trends, enhancing signal reliability.
  2. Sets clear stop-loss and take-profit levels, helping to manage risk and lock in profits.
  3. Applicable to multiple timeframes and different markets, offering some level of versatility.
  4. Clear logic, easy to understand and implement.

Strategy Risks

  1. In choppy markets, frequent crossovers may lead to multiple false signals, resulting in losses.
  2. Fixed stop-loss and take-profit levels may not adapt well to different market conditions, leading to potential opportunity costs or larger losses.
  3. The strategy relies on historical data and may not adapt well to sudden events or fundamental changes.

Strategy Optimization Directions

  1. Introduce adaptive stop-loss and take-profit mechanisms, such as adjusting the levels based on volatility (e.g., ATR), to better adapt to different market conditions.
  2. Incorporate other indicators or factors, such as volume, Relative Strength Index (RSI), etc., to further filter signals and improve reliability.
  3. Optimize parameters (e.g., EMA periods, stop-loss and take-profit percentages) to find the best-performing combination for specific markets or instruments.
  4. Consider introducing risk management measures, such as position sizing, to control the risk exposure of individual trades.

Summary

This strategy utilizes the crossover of 8-period and 21-period EMAs, combined with HL and LH price patterns, to identify trend reversals and generate trading signals. Clear stop-loss and take-profit rules help manage risk and lock in profits. However, the strategy may generate false signals in choppy markets, and fixed stop-loss and take-profit levels may not adapt well to different market conditions. To further improve, consider introducing adaptive stop-loss and take-profit, incorporating other indicators, optimizing parameters, and introducing risk management measures. Overall, the strategy provides a framework for momentum and trend-following trading but requires adjustments and optimizations based on specific markets and individual preferences.
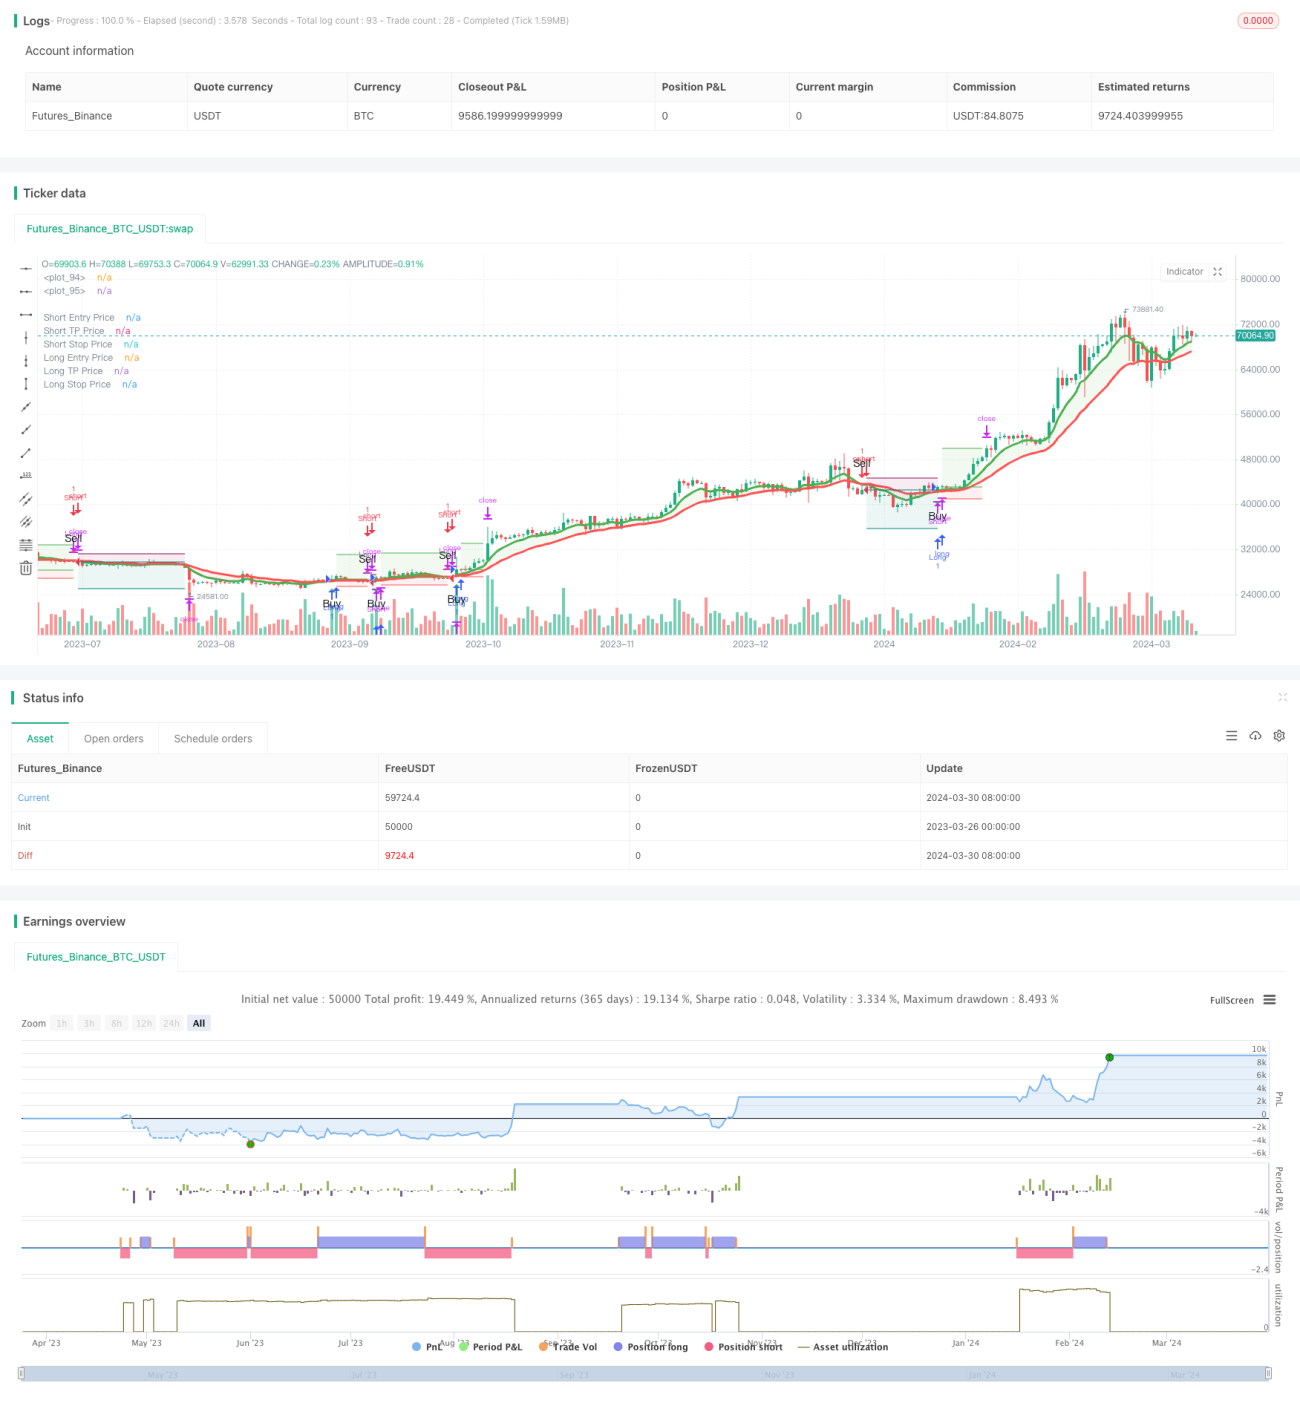

/*backtest
start: 2023-03-26 00:00:00
end: 2024-03-31 00:00:00
period: 1d
basePeriod: 1h
exchanges: [{"eid":"Futures_Binance","currency":"BTC_USDT"}]
*/

//@version=5
strategy('Trend Following 8&21EMA with strategy tester [ukiuro7]', overlay=true, process_orders_on_close=true, calc_on_every_tick=true, initial_capital = 10000)

//INPUTS
lh3On = true
hl3On = true
emaOn = input(title='105ema / 30min', defval=true) 
assistantOn = input(title='Assistant', defval=true)
textOn = input(title='Text', defval=true)

showRiskReward = input.bool(true, title='Show Risk/Reward Area', group="TP/SL")
stopPerc = input.float(5.0, step=0.1, minval=0.1, title='Stop-Loss %:',group="TP/SL") / 100
tpPerc = input.float(16.0, step=0.1, minval=0.1, title='Take-Profit %:',group="TP/SL") / 100

backtestFilter = input(false, title='Backtest Entries to Date Range',group="Backtest Date Range")
i_startTime = input(defval=timestamp('01 Jan 2022 00:00'), inline="b_1", title='Start',group="Backtest Date Range")
i_endTime = input(defval=timestamp('01 Jan 2029 00:00'), inline="b_1", title='End',group="Backtest Date Range")
inDateRange = true

message_long_entry = input.string(title='Alert Msg: LONG Entry', defval ='', group='Alert Message')
message_short_entry = input.string(title='Alert Msg: SHORT Entry', defval='', group='Alert Message')
message_long_exit = input.string(title='Alert Msg: LONG SL/TP', defval='', group='Alert Message')
message_short_exit = input.string(title='Alert Msg: SHORT SL/TP', defval='', group='Alert Message')  

//CALCS
threeHigherLows() =>
    low[0] >= low[1] and low[1] >= low[2]

threeLowerHighs() =>
    high[2] >= high[1] and high[1] >= high[0]

breakHigher() =>
    padding = timeframe.isintraday ? .02 : .1
    high >= high[1] + padding

breakLower() =>
    padding = timeframe.isintraday ? .02 : .1
    low <= low[1] - padding

lh3 = threeLowerHighs() and lh3On
lh3bh = lh3[1] and breakHigher() and lh3On

hl3 = threeHigherLows() and hl3On
hl3bl = hl3[1] and breakLower() and hl3On

ema8 = ta.ema(close, 8)
ema21 = ta.ema(close, 21)

//VARS
var float longStop = na, var float longTp = na
var float shortStop = na, var float shortTp = na

//CONDS
isUptrend = ema8 >= ema21
isDowntrend = ema8 <= ema21
trendChanging = ta.cross(ema8, ema21)

buySignal = lh3bh and lh3[2] and lh3[3] and isUptrend and timeframe.isintraday
sellSignal = hl3bl and hl3[2] and hl3[3] and isDowntrend and timeframe.isintraday

goingDown = hl3 and isDowntrend and timeframe.isintraday
goingUp = lh3 and isUptrend and timeframe.isintraday

projectXBuy = trendChanging and isUptrend
projectXSell = trendChanging and isDowntrend

longCond = trendChanging and isUptrend and assistantOn
shortCond = trendChanging and isDowntrend and assistantOn

//STRATEGY
if shortCond and strategy.position_size > 0 and barstate.isconfirmed
    strategy.close('Long', comment='CLOSE LONG', alert_message=message_long_exit)

if longCond and strategy.position_size < 0 and barstate.isconfirmed
    strategy.close('Short', comment='CLOSE SHORT', alert_message=message_short_exit) 

if longCond and strategy.position_size <= 0 and barstate.isconfirmed and inDateRange
    longStop := close * (1 - stopPerc)
    longTp := close * (1 + tpPerc)
    strategy.entry('Long', strategy.long, comment='LONG', alert_message=message_long_entry)
    strategy.exit('Long Exit', 'Long', comment_loss="SL LONG", comment_profit = "TP LONG", stop=longStop, limit=longTp, alert_message=message_long_exit)

if shortCond and strategy.position_size >= 0 and barstate.isconfirmed and inDateRange
    shortStop := close * (1 + stopPerc)
    shortTp := close * (1 - tpPerc)
    strategy.entry('Short', strategy.short, comment='SHORT', alert_message=message_short_entry)
    strategy.exit('Short Exit', 'Short', comment_loss="SL SHORT", comment_profit="TP SHORT", stop=shortStop, limit=shortTp, alert_message=message_short_exit)

//PLOTS
plotshape(longCond, style=shape.triangleup, location=location.belowbar, color=color.new(color.green, 0), size=size.small, text='Buy')
plotshape(shortCond, style=shape.triangledown, location=location.abovebar, color=color.new(color.red, 0), size=size.small, text='Sell')
plotchar(trendChanging and isUptrend and close < open and assistantOn, char='!', location=location.abovebar, color=color.new(color.green, 0), size=size.small)

aa = plot(ema8, linewidth=3, color=color.new(color.green, 0), editable=true)
bb = plot(ema21, linewidth=3, color=color.new(color.red, 0), editable=true)
fill(aa, bb, color=isUptrend ? color.new(color.green,90) : color.new(color.red,90))
buyZone = isUptrend and lh3 and high < ema21 and timeframe.isintraday
sellZone = isDowntrend and hl3 and low > ema21 and timeframe.isintraday

L1 = plot(showRiskReward and strategy.position_size > 0 ? strategy.position_avg_price : na, color=color.new(color.green, 0), linewidth=1, style=plot.style_linebr, title='Long Entry Price')
L2 = plot(showRiskReward and strategy.position_size > 0 ? longTp : na, color=color.new(color.green, 0), linewidth=1, style=plot.style_linebr, title='Long TP Price')
L3 = plot(showRiskReward and strategy.position_size > 0 ? longStop : na, color=color.new(color.red, 0), linewidth=1, style=plot.style_linebr, title='Long Stop Price')

S1 = plot(showRiskReward and strategy.position_size < 0 ? strategy.position_avg_price : na, color=color.new(color.teal, 0), linewidth=1, style=plot.style_linebr, title='Short Entry Price')
S2 = plot(showRiskReward and strategy.position_size < 0 ? shortTp : na, color=color.new(color.teal, 0), linewidth=1, style=plot.style_linebr, title='Short TP Price')
S3 = plot(showRiskReward and strategy.position_size < 0 ? shortStop : na, color=color.new(color.maroon, 0), linewidth=1, style=plot.style_linebr, title='Short Stop Price')

fill(L1, L2, color=color.new(color.green, 90))
fill(L1, L3, color=color.new(color.red, 90))
fill(S1, S2, color=color.new(color.teal, 90))
fill(S1, S3, color=color.new(color.maroon, 90))

bgcolor(inDateRange == false ? color.new(color.red,90) : na, title="Backtest Off-Range") 


More