资源加载中... loading...

Dynamic Threshold Price Change Breakout Strategy

Author: ChaoZhang, Date: 2024-04-01 12:03:59
Tags:

img

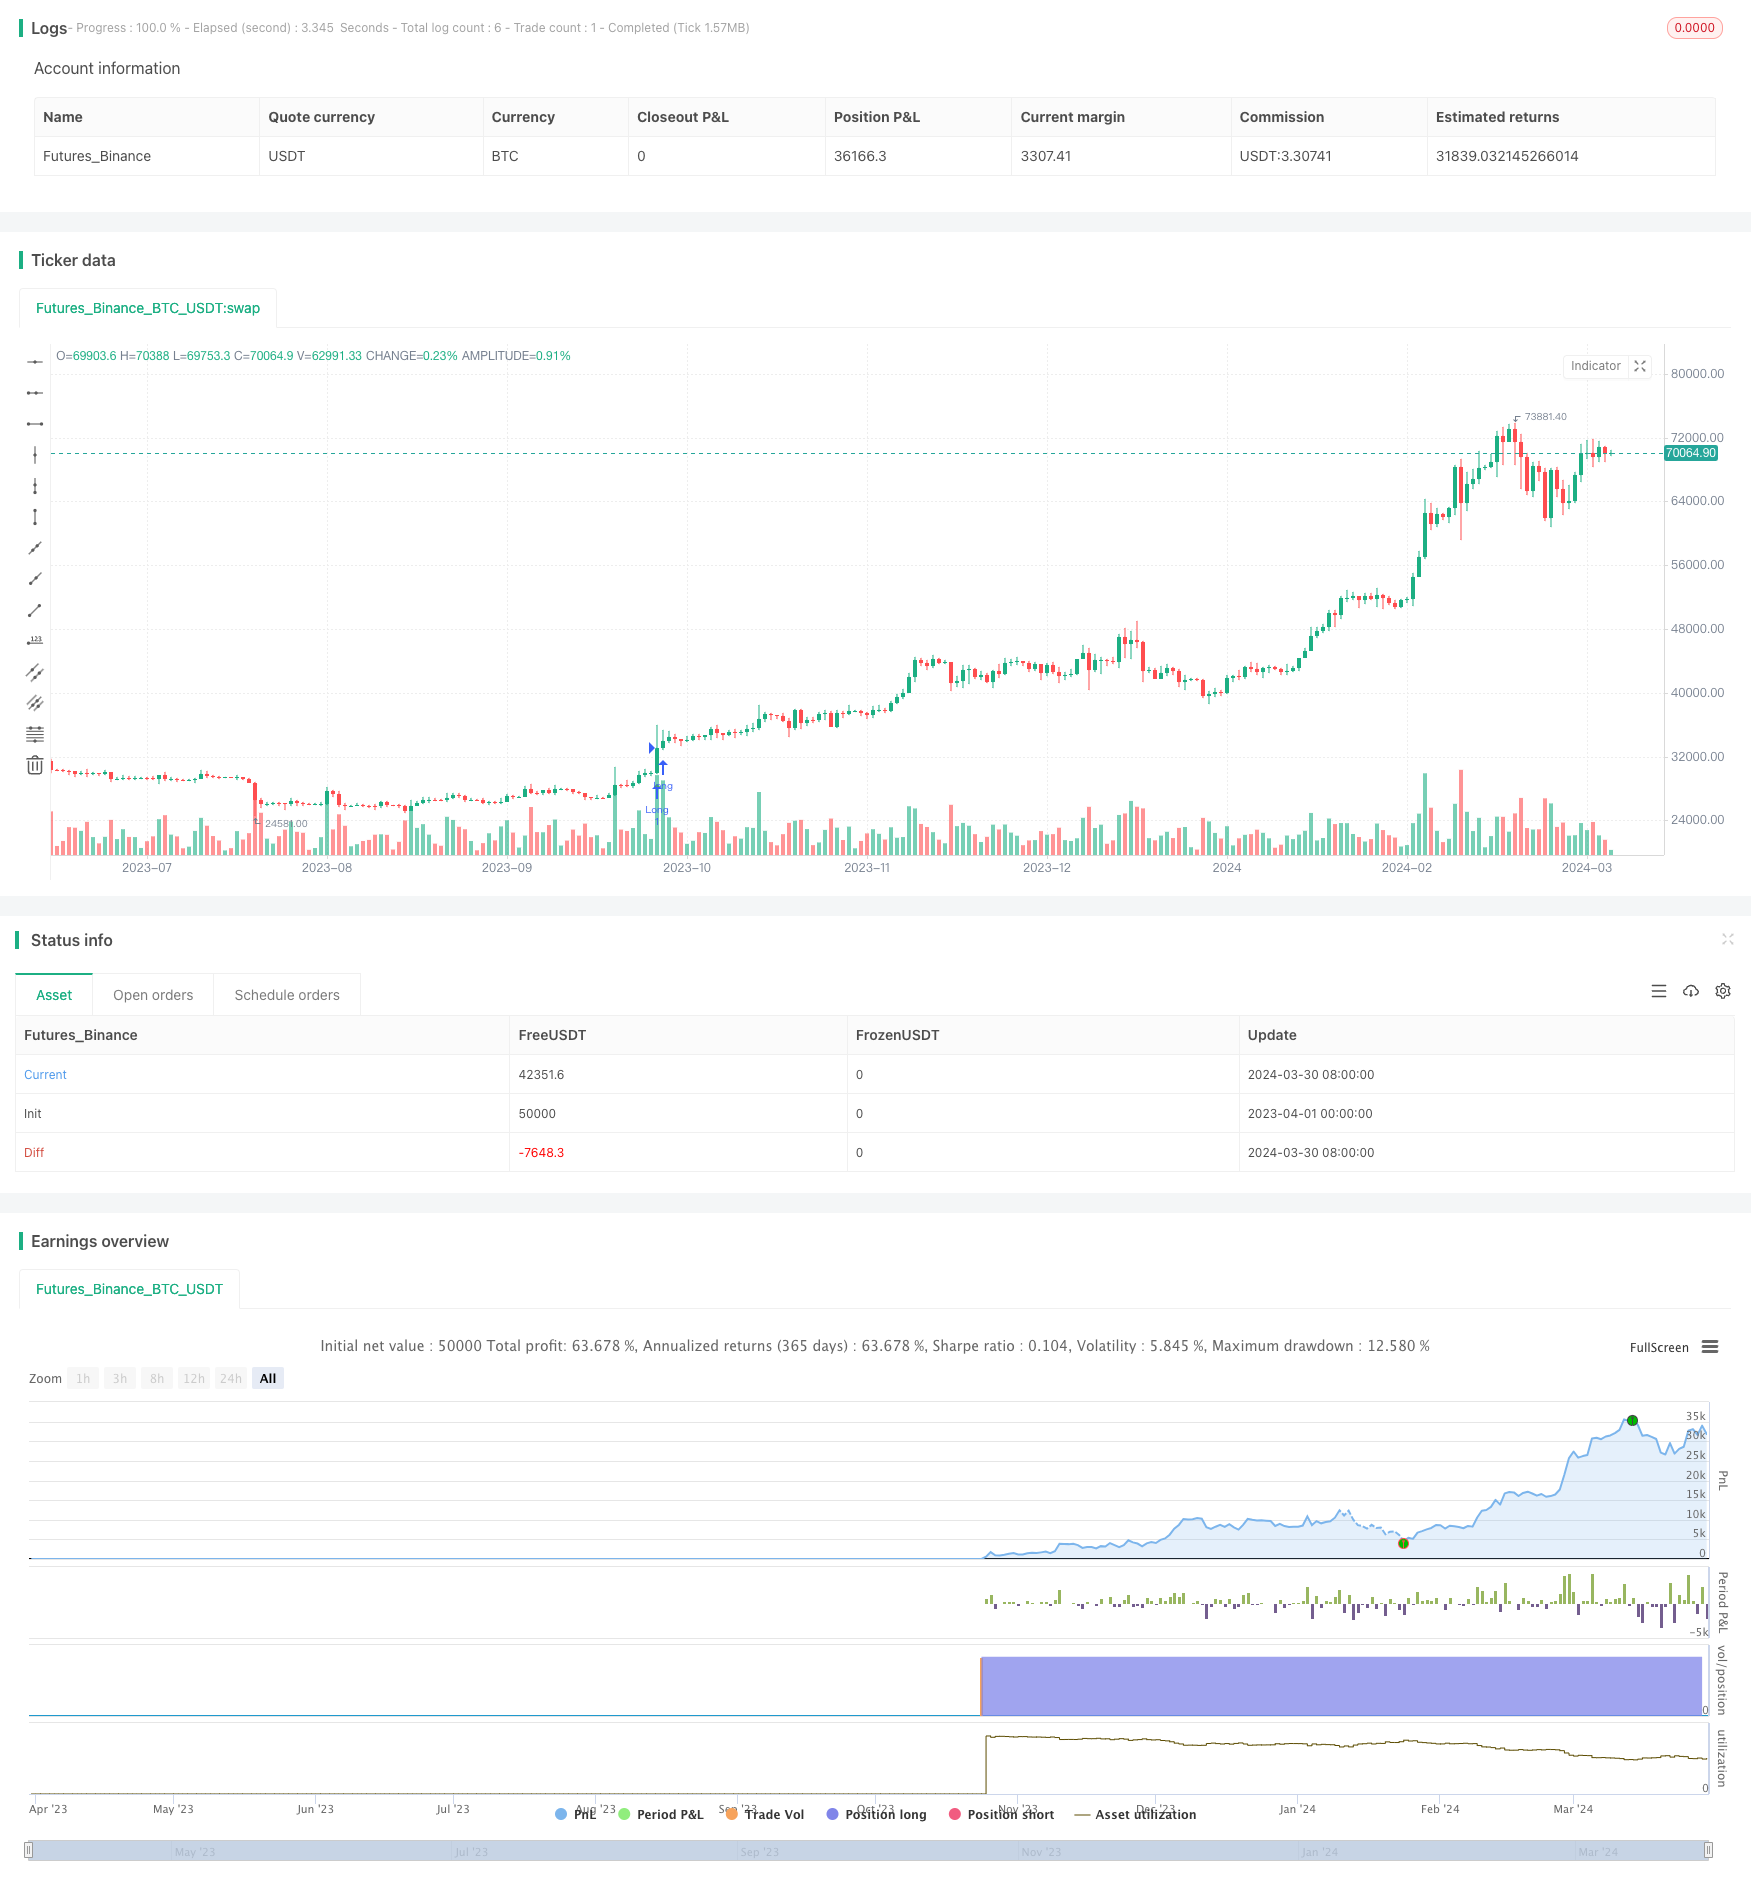
This strategy is named “Dynamic Threshold Price Change Breakout Strategy”. The main idea of this strategy is to set a dynamic threshold, and when the price change rate exceeds this threshold, a buy signal is generated, and when the price change rate is lower than the negative value of this threshold, a sell signal is generated. At the same time, the strategy also sets a stop loss. When the price falls below the lowest price of the previous 6 candles, the position will be closed.

Strategy Principle

The core of this strategy is to calculate the price change rate, which is obtained by dividing the current closing price by the previous closing price and then subtracting 1. Then, the calculated price change rate is compared with the threshold input by the user. When the price change rate is greater than or equal to the threshold, if there is no current position or a short position is held, a buy signal is generated; when the price change rate is less than or equal to the negative value of the threshold, if there is no current position or a long position is held, a sell signal is generated. After generating a buy signal, the strategy will record the lowest price of the previous 6 candles as the stop loss price. Once the price falls below the stop loss price, the strategy will close the long position.

Strategy Advantages

  1. This strategy uses a dynamic threshold, which can adapt to different market environments and has a certain degree of flexibility.
  2. The strategy logic is simple and clear, easy to understand and implement.
  3. A stop loss is set to control risk to a certain extent.
  4. Suitable for use in rising markets, it can effectively capture the upward trend.

Strategy Risks

  1. This strategy may experience frequent trading in volatile markets, leading to increased transaction costs.
  2. The stop loss setting may not be flexible enough, and in some cases may lead to premature stop loss.
  3. The strategy only considers the price change rate factor and does not consider other factors that may affect the price trend, such as trading volume and market sentiment.

Strategy Optimization Directions

  1. More indicators, such as trading volume and volatility, can be considered to be introduced to improve the reliability of the strategy.
  2. The stop loss setting can be optimized, such as using a trailing stop or a dynamic stop loss, to make the stop loss more flexible.
  3. Parameters can be optimized, such as the size of the threshold and the calculation period of the stop loss, to find the optimal parameter combination.
  4. Position management can be added to dynamically adjust positions according to market conditions to control risk.

Summary

The “Dynamic Threshold Price Change Breakout Strategy” generates trading signals by comparing the price change rate with a dynamic threshold, which is suitable for use in rising markets. The strategy logic is simple and clear, with a certain degree of flexibility and risk control capabilities. However, this strategy also has some shortcomings, such as frequent trading in volatile markets and inflexible stop loss settings. In the future, we can consider optimizing the strategy from aspects such as introducing more indicators, optimizing stop loss settings, optimizing parameters, and adding position management to further improve the performance of the strategy.


/*backtest
start: 2023-04-01 00:00:00
end: 2024-03-31 00:00:00
period: 1d
basePeriod: 1h
exchanges: [{"eid":"Futures_Binance","currency":"BTC_USDT"}]
*/

//@version=4
strategy("Price Change", shorttitle="Price Change", overlay=true)

change = input(00.1, title="Change", minval=0.0001, maxval=1, type=input.float)


// Calculate price change
priceChange = close / close[1] - 1

// Buy and Sell Signals
buyp = priceChange >= change
sellp = priceChange <= (change * -1)

// Initialize position and track the current position
var int position = na

// Strategy entry conditions
buy_condition = buyp and (na(position) or position == -1)
sell_condition = sellp and (na(position) or position == 1)

var float stop = na

if (buy_condition)
    strategy.entry("Long", strategy.long)
    stop := lowest(low, 6)
    position := 1
if (sell_condition or low < stop)
    strategy.close("Long")
    position := -1

// Plot Buy and Sell signals using plotshape
plotshape(series=buy_condition, title="Buy Signal", location=location.belowbar, color=color.green, style=shape.triangleup, size=size.small)
plotshape(series=sell_condition, title="Sell Signal", location=location.abovebar, color=color.red, style=shape.triangledown, size=size.small)

template: strategy.tpl:40:21: executing "strategy.tpl" at <.api.GetStrategyListByName>: wrong number of args for GetStrategyListByName: want 7 got 6