Modified Bollinger Bands Strategy

Author: ChaoZhang, Date: 2024-04-01 15:58:04
Tags:

img

Overview

The Modified Bollinger Bands Strategy is a technical analysis trading strategy designed to capture pullback buying opportunities in strong uptrends. The strategy combines Bollinger Bands, moving averages, and the Stochastic RSI indicator to determine optimal entry points. When the price pulls back to the lower Bollinger Band in an uptrend and the Stochastic RSI indicates oversold conditions, the strategy generates a buy signal. The position is closed when the price breaks above the upper Bollinger Band.

Strategy Principles

  1. Bollinger Bands: Bollinger Bands consist of three lines: a middle line, which is a moving average, and upper and lower bands that are a certain number of standard deviations away from the middle line. Bollinger Bands reflect the volatility of prices; when price volatility increases, the bands widen, and when price volatility decreases, the bands contract.
  2. Moving Average: The strategy uses a 50-period simple moving average (SMA) as a trend filter. Long positions are only considered when the closing price is above the moving average, indicating an uptrend.
  3. Stochastic RSI: The Stochastic RSI is a momentum oscillator that measures the level of the RSI relative to its high-low range over a set period of time. It generates overbought and oversold signals. In this strategy, the Stochastic RSI provides an additional condition for entering a trade, aiming to identify moments when the price has pulled back to an oversold area within a prevailing uptrend, offering a potential buying opportunity.

The strategy’s buy conditions are as follows:

  • The closing price falls below the lower Bollinger Band, suggesting a potential overshoot to the downside.
  • The closing price is still above the 50-period SMA, indicating that the overall trend remains bullish.
  • The Stochastic RSI shows oversold conditions (the K line is below a user-defined threshold, typically 20), suggesting a potential reversal or pullback from the recent downtrend.

The strategy’s sell (exit long position) condition is as follows:

  • The closing price breaks above the upper Bollinger Band, implying that the price may have reached a short-term top and could be due for a reversal or pullback.

Strategy Advantages

  1. Trend Following: By using a moving average as a trend filter, the strategy helps traders identify entry opportunities in strong uptrends. This helps avoid trading in downtrends, potentially increasing the strategy’s win rate.
  2. Volatility Management: Bollinger Bands help traders understand the volatility of prices. By buying at the lower Bollinger Band, the strategy attempts to enter when prices have pulled back to relatively low levels, potentially profiting as the trend resumes.
  3. Momentum Confirmation: The Stochastic RSI indicator helps confirm potential buying opportunities. By requiring the Stochastic RSI to show oversold conditions, the strategy tries to avoid entering prematurely when a downtrend is still dominant.

Strategy Risks

  1. Lack of Risk Management: The strategy does not have built-in stop-loss or position sizing features. These are crucial risk management tools in real-world trading. Traders need to determine appropriate stop-loss levels and position sizes based on their risk tolerance and trading objectives.
  2. Parameter Sensitivity: The strategy’s performance may be sensitive to the choice of Bollinger Band length, moving average length, and Stochastic RSI parameters. Different parameter combinations may yield different results. Optimization and backtesting of these parameters are necessary before implementing the strategy.
  3. Trend Reversals: Although the strategy attempts to buy pullbacks in uptrends, there is no guarantee that the trend will continue. If the trend suddenly reverses, the strategy may suffer losses.

Strategy Optimization Directions

  1. Adding Risk Management: Incorporate stop-loss and position sizing features into the strategy to help limit potential losses and optimize risk-reward. Consider dynamic stop-losses based on ATR (Average True Range) or percentage drawdowns.
  2. Parameter Optimization: Optimize the Bollinger Band length, moving average length, Bollinger Band standard deviation multiplier, and Stochastic RSI parameters to improve the strategy’s performance under different market conditions. Optimization techniques like genetic algorithms or grid search can be used to find the best parameter combinations.
  3. Combining with Other Indicators: Consider incorporating other technical indicators, such as MACD or OBV, into the strategy to provide additional confirmation signals and help filter out false signals.
  4. Backtesting and Forward Testing: Conduct thorough backtesting of the strategy under various market conditions and timeframes. Use forward testing to evaluate the strategy’s performance on out-of-sample data to validate its robustness.

Summary

The Modified Bollinger Bands Strategy is a simple yet effective trading strategy that aims to capture pullback buying opportunities in strong uptrends. By combining Bollinger Bands, moving averages, and the Stochastic RSI indicator, the strategy attempts to identify situations where the price is oversold but the overall trend remains bullish. While the strategy has some merits, such as trend following and volatility management, it also carries certain risks, such as lack of risk management and parameter sensitivity. The strategy can be further improved by incorporating appropriate risk management techniques, optimizing parameters, and combining with other indicators. Comprehensive backtesting and forward testing are necessary before applying the strategy in real-world trading.


/*backtest
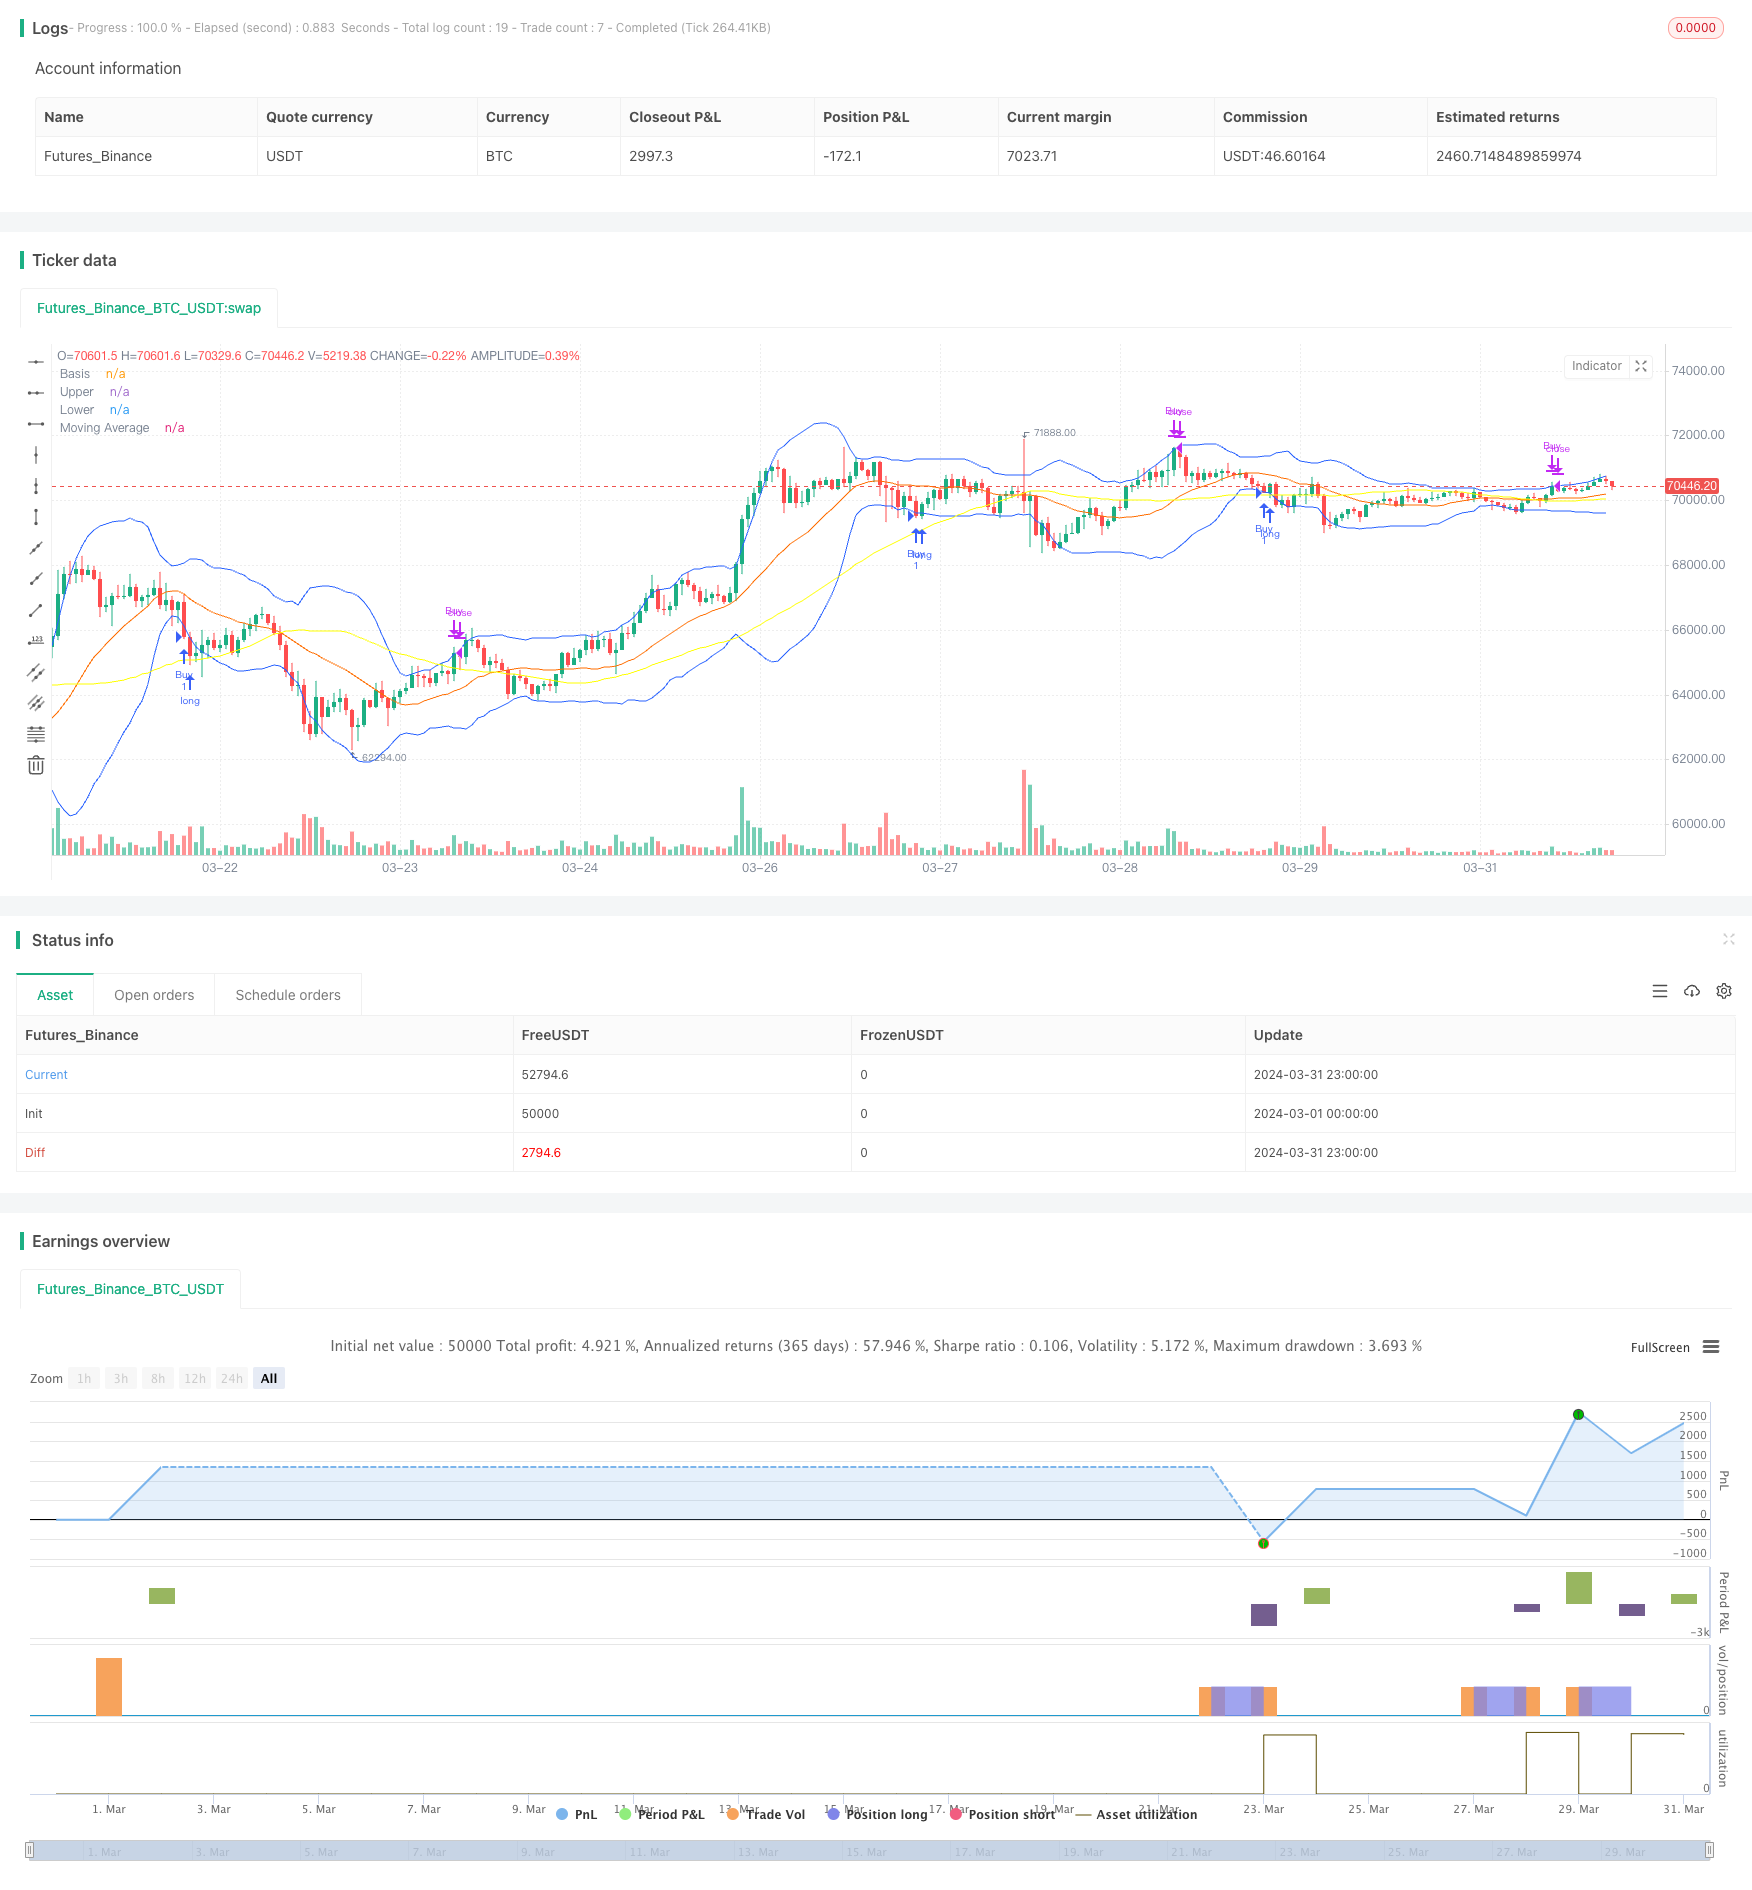
start: 2024-03-01 00:00:00
end: 2024-03-31 23:59:59
period: 1h
basePeriod: 15m
exchanges: [{"eid":"Futures_Binance","currency":"BTC_USDT"}]
*/

//@version=5
strategy("Modified Bollinger Bands Strategy", shorttitle="Mod BB Strategy", overlay=true)

// Input parameters for Bollinger Bands
length = input.int(20, minval=1, title="BB Length")
mult = input.float(2.0, minval=0.001, maxval=50, title="BB StdDev")

// Input parameters for moving average
maLength = input.int(50, minval=1, title="MA Length")

// Input parameters for Stochastic RSI
kLength = input.int(14, title="Stoch RSI K Length")
dLength = input.int(3, title="Stoch RSI D Length")
rsiLength = input.int(14, title="Stoch RSI Length")
oversold = input.float(20, title="Stoch RSI Oversold Level")

// Calculate Bollinger Bands
basis = ta.sma(close, length)
dev = mult * ta.stdev(close, length)
upperBB = basis + dev
lowerBB = basis - dev

// Calculate Moving Average
movingAvg = ta.sma(close, maLength)

// Calculate Stochastic RSI
rsi = ta.rsi(close, rsiLength)
k = ta.sma(ta.stoch(rsi, rsi, rsi, kLength), dLength)
d = ta.sma(k, dLength)

// Define buy and sell conditions
longCondition = close < lowerBB and close > movingAvg and k < oversold
exitCondition = close > upperBB

// Plotting
plot(basis, "Basis", color=color.new(#FF6D00, 0))
plot(upperBB, "Upper", color=color.new(#2962FF, 0))
plot(lowerBB, "Lower", color=color.new(#2962FF, 0))
plot(movingAvg, "Moving Average", color=color.new(#FFFF00, 0))

// Execute strategy
if (longCondition)
    strategy.entry("Buy", strategy.long)
if (exitCondition)
    strategy.close("Buy")


More