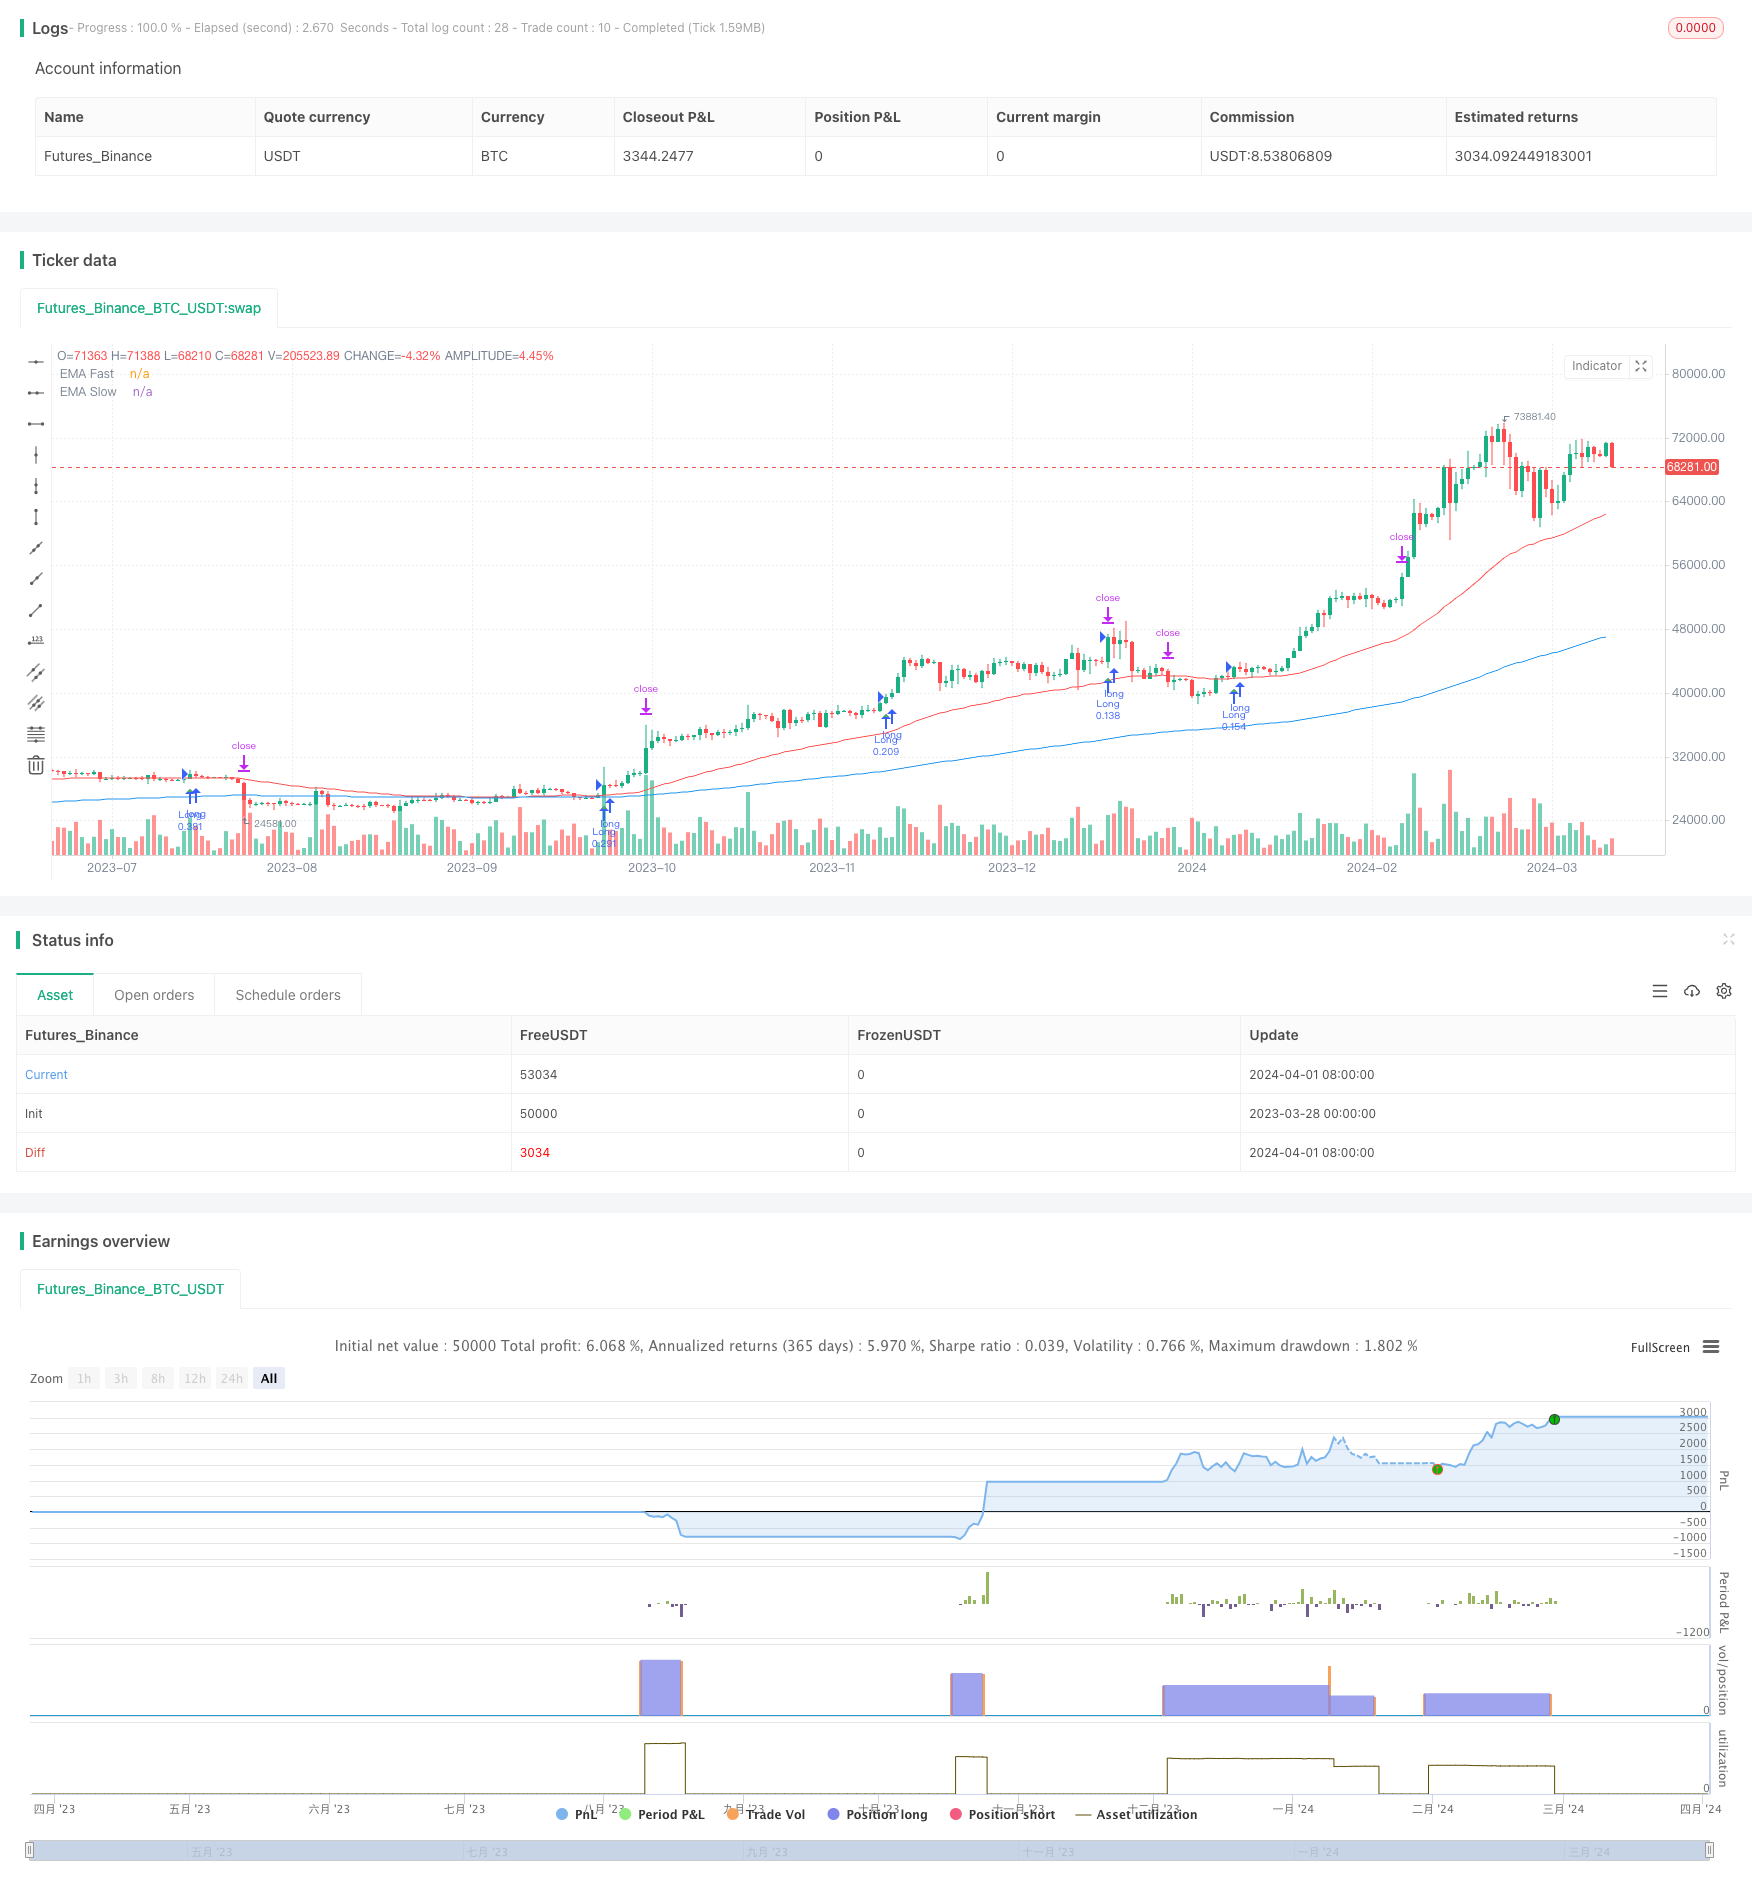
概述
该策略采用相对强弱指数(RSI)、移动平均线收敛散度指标(MACD)、指数移动平均线(EMA)和平均真实波幅(ATR)等多个技术指标,结合动态仓位管理和止损止盈机制,实现了一个全面的趋势追踪量化交易策略。该策略通过分析价格的速度、方向、强度以及波动率,在多个市场环境下自适应调整,以捕捉市场趋势,控制风险。
策略原理
- RSI用于衡量价格变动的速度和幅度,识别超买超卖状态,为交易提供信号。
- MACD通过对快速和慢速移动平均线的差值分析,判断价格的动量、方向和强度变化,提示趋势转折点。
- 双EMA交叉确认趋势方向,快线突破慢线视为看多信号,快线跌破慢线视为看空信号。
- ATR衡量市场波动率,用于动态调整止损和止盈水平,以适应不同的市场状态。
- 结合RSI、MACD与EMA的多重条件,策略在多头趋势形成时开多仓,在空头趋势形成时开空仓。
- 采用ATR作为止损参考,并设置动态利润目标,单笔交易风险收益比保持不变。
- 基于策略风险敞口和标的资产波动率,动态调整每笔交易仓位,实现风险敞口的恒定。
策略优势
- 趋势跟踪:策略基于多个技术指标确认趋势,有效捕捉市场的中长期趋势机会。
- 动态风控:止损和止盈水平根据ATR动态调整,适应不同波动率市场状态,控制单笔交易风险。
- 仓位管理:考虑账户规模和标的波动率,自动优化每笔交易仓位,使整体风险敞口保持稳定。
- 适应性强:策略参数可灵活调整,适用于不同市场、品种和投资风格。
- 严格纪律:基于量化规则执行交易,消除主观情绪影响,保证策略的客观性和一致性。
策略风险
- 市场风险:金融市场本身的不确定性,包括经济、政治、突发事件等因素影响,可能导致策略表现与预期偏离。
- 参数风险:不恰当的参数设置可能导致策略过度拟合历史数据,在实际应用中表现欠佳。
- 滑点和交易成本:实际交易中的滑点和手续费可能影响策略的净收益。
- 极端行情:策略在极端行情下(如快速变化的波动率环境、流动性枯竭等)可能面临较大回撤。
策略优化方向
- 参数优化:通过对历史数据进行回测,寻找最优参数组合,提高策略的稳健性和适应性。
- 多空仓位动态配置:根据市场趋势强度和方向,动态调整多空仓位比例,更好地把握趋势行情。
- 加入市场状态判断:结合波动率、相关性等指标,判断市场状态,在不同状态下采取相应的策略调整。
- 结合基本面分析:将宏观经济、行业趋势等基本面因素纳入考量,指导技术指标的使用和解释。
- 风险控制优化:在动态止损止盈的基础上,加入高级风险管理手段,如投资组合优化、对冲工具运用等。
总结
该策略通过RSI、MACD、EMA等技术指标的有机结合,构建了一个全面的趋势追踪交易系统。策略采用动态仓位和风险管理,在捕捉趋势机会的同时控制回撤风险。策略适用性广,可根据市场特点和投资需求进行优化调整。但在实际应用中,需关注市场风险、参数设置、交易成本等因素,并定期评估和优化策略。通过审慎的风险管理和持续的优化改进,该策略有望成为一个稳健、高效的量化交易工具。
策略源码
//@version=5
strategy("Enhanced Professional Strategy V6", shorttitle="EPS V6", overlay=true)

// Input parameters with tooltips for enhanced user understanding.
rsiPeriod = input.int(14, title="RSI Period", tooltip="Period length for the Relative Strength Index. Standard setting is 14. Adjust to increase or decrease sensitivity.")
macdFastLength = input.int(12, title="MACD Fast Length", tooltip="Length for the fast EMA in the MACD. Typical setting is 12. Adjust for faster signal response.")
macdSlowLength = input.int(26, title="MACD Slow Length", tooltip="Length for the slow EMA in the MACD. Standard setting is 26. Adjust for slower signal stabilization.")
macdSmoothing = input.int(9, title="MACD Smoothing", tooltip="Smoothing length for the MACD signal line. Commonly set to 9. Modifies signal line smoothness.")
atrLength = input.int(14, title="ATR Length", tooltip="Period length for the Average True Range. Used to measure market volatility.")
riskRewardRatio = input.float(2.0, title="Risk/Reward Ratio", tooltip="Your target risk vs. reward ratio. A setting of 2.0 aims for profits twice the size of the risk.")
emaFastLength = input.int(50, title="EMA Fast Length", tooltip="Period length for the fast Exponential Moving Average. Influences trend sensitivity.")
emaSlowLength = input.int(200, title="EMA Slow Length", tooltip="Period length for the slow Exponential Moving Average. Determines long-term trend direction.")
trailStopMultiplier = input.float(3.0, title="Trailing Stop Multiplier", tooltip="Multiplier for ATR to set trailing stop levels. Adjusts stop loss sensitivity to volatility.")
riskPerTrade = input.float(1.0, title="Risk Per Trade (%)", tooltip="Percentage of equity risked per trade. Helps maintain consistent risk management.")
targetProfitRatio = input.float(2.0, title="Target Profit Ratio", tooltip="Multiplier for setting a profit target above the risk/reward ratio. For capturing extended gains.")
displayLines = input.bool(true, title="Display Stop/Target Lines", tooltip="Enable to show stop loss and target profit lines on the chart for visual reference.")

// Technical Indicator Calculations
rsi = ta.rsi(close, rsiPeriod)
[macdLine, signalLine, _] = ta.macd(close, macdFastLength, macdSlowLength, macdSmoothing)
atr = ta.atr(atrLength)
emaFast = ta.ema(close, emaFastLength)
emaSlow = ta.ema(close, emaSlowLength)

// Define trailing stop based on ATR
atrTrailStop = atr * trailStopMultiplier

// Entry Conditions for Long and Short Trades
longCondition = ta.crossover(macdLine, signalLine) and rsi < 70 and close > emaFast and emaFast > emaSlow
shortCondition = ta.crossunder(macdLine, signalLine) and rsi > 30 and close < emaFast and emaFast < emaSlow

// Dynamic Position Sizing Based on Risk Management
slPoints = atr * 2
riskAmount = strategy.equity * riskPerTrade / 100
qty = riskAmount / slPoints

// Strategy Execution with Entry and Exit Conditions
if (longCondition)
    strategy.entry("Long", strategy.long, qty=qty)
    strategy.exit("Exit Long", "Long", stop=close - atrTrailStop, limit=close + (atrTrailStop * riskRewardRatio))
    strategy.exit("Target Profit Long", "Long", limit=close + (atrTrailStop * riskRewardRatio * targetProfitRatio))

if (shortCondition)
    strategy.entry("Short", strategy.short, qty=qty)
    strategy.exit("Exit Short", "Short", stop=close + atrTrailStop, limit=close - (atrTrailStop * riskRewardRatio))
    strategy.exit("Target Profit Short", "Short", limit=close - (atrTrailStop * riskRewardRatio * targetProfitRatio))

// Visualization: EMA lines and Entry/Exit Shapes
plot(emaFast, "EMA Fast", color=color.red)
plot(emaSlow, "EMA Slow", color=color.blue)
plotshape(series=longCondition and displayLines, style=shape.triangleup, location=location.belowbar, color=color.green, size=size.small, title="Long Entry")
plotshape(series=shortCondition and displayLines, style=shape.triangledown, location=location.abovebar, color=color.red, size=size.small, title="Short Entry")

// Educational Instructions & Tips
// Note: Use comments for static educational content within the script.
// Adjust the 'RSI Period' and 'MACD Lengths' to match the market's volatility.
// The 'Risk Management Settings' align the strategy with your risk tolerance and capital management plan.
// 'Visualization and Control Settings' customize the strategy's appearance on your chart.
// Experiment with 'ATR Lengths' and 'Multipliers' to optimize the strategy for different market conditions.
// Regularly review trade history and adjust 'Risk Per Trade' to manage drawdowns effectively.
相关推荐